Current Projects
What I'm currently working on.

Svelte Berlin Meetup
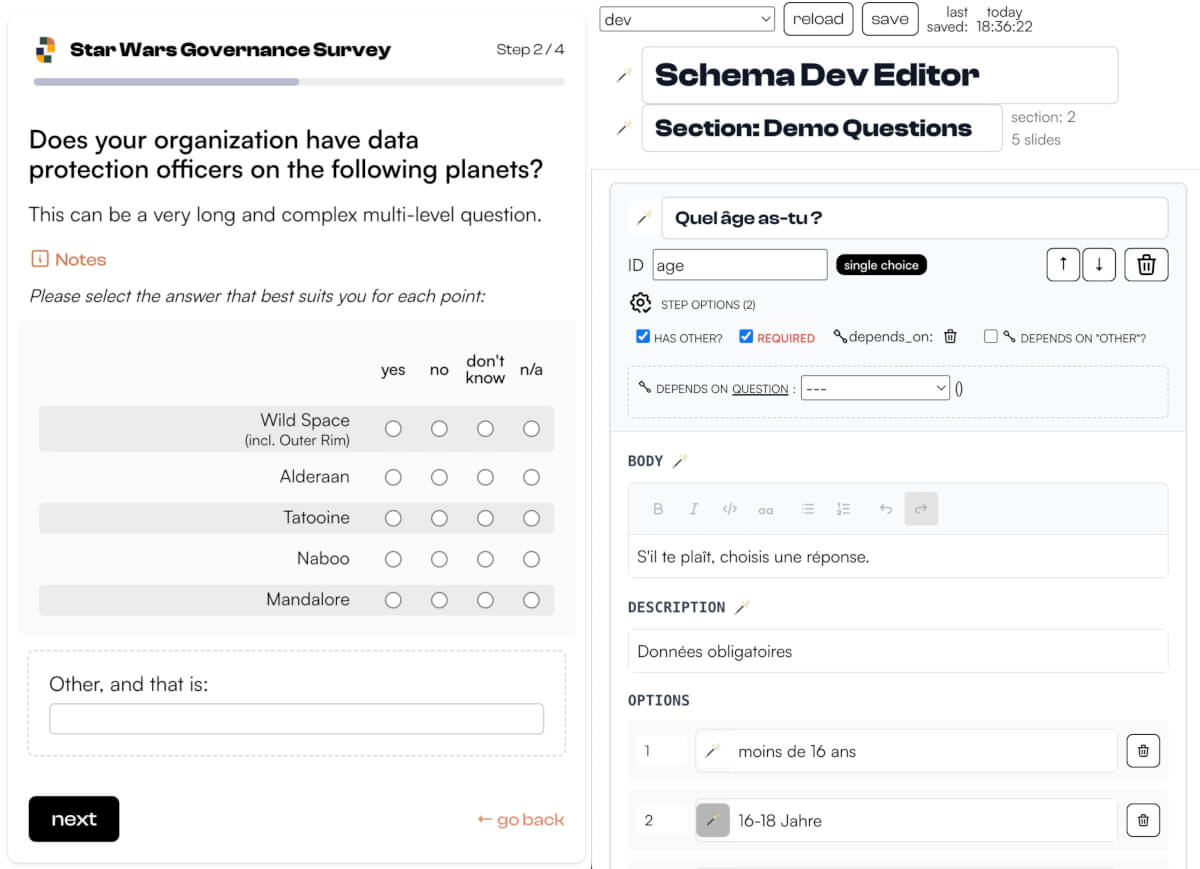
E2E Community Survey Kit
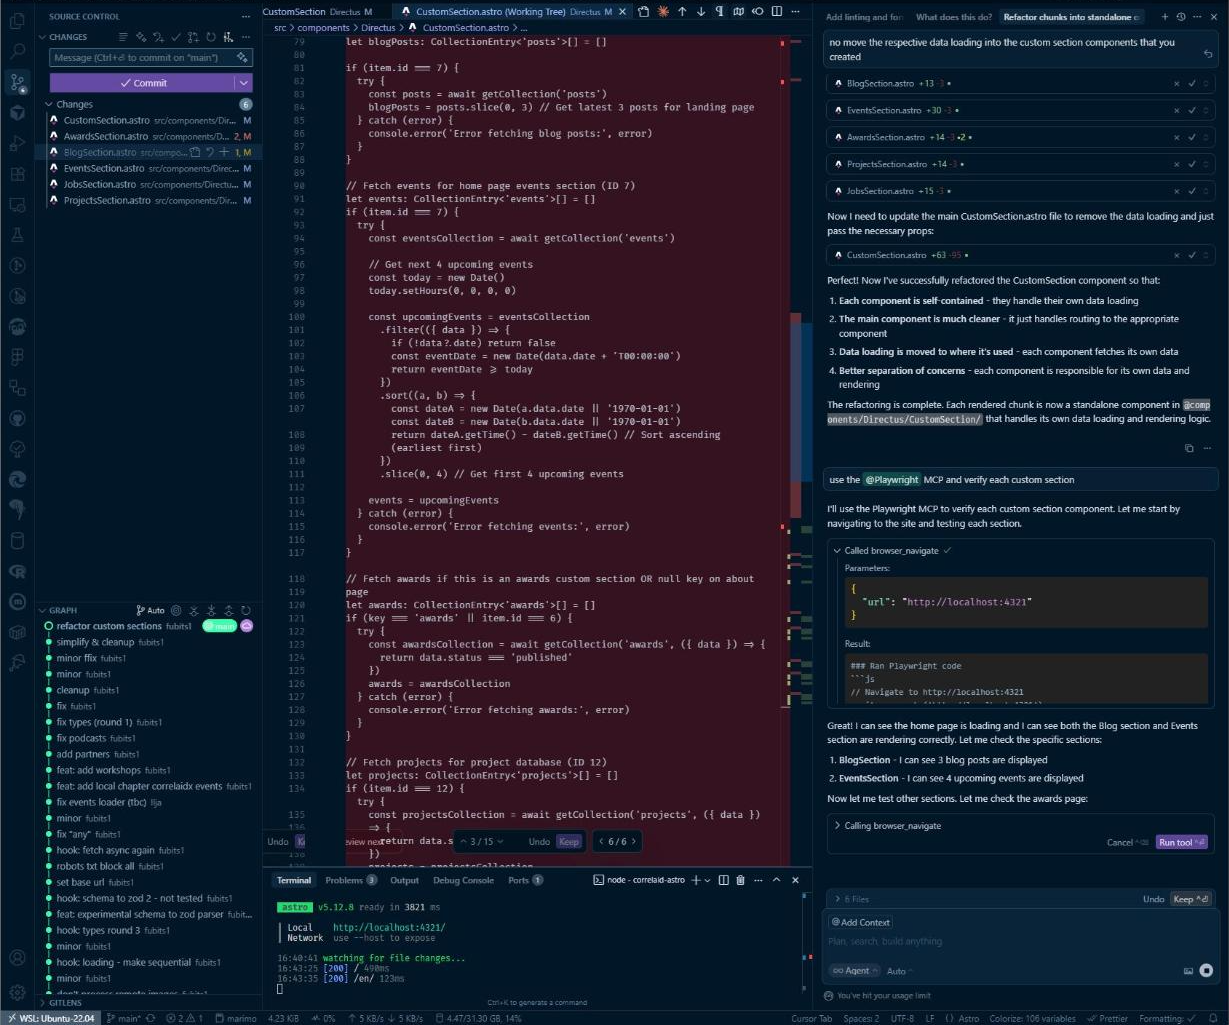
SvelteKit to Astro+Svelte Migration
Details
Our first event will take place Dec 9th: 3 talks (in English), Pizza, networking.Bookmark the Svelte Berlin Meetup website and join the meetup (and the larger Svelte Society network) on guild.host. Details
- rich-text survey editor with DeepL-🪄 for all input fields
- multilanguage (with Paraglide i18n)
- surveys only exist as dynamic virtual routes - survey state (pre, active, post) is remote-controlled via endpoints as webhooks and JSON config files in Supabase Storage
- survey schema is streamed from Supabase storage as JSON
- (internal) realtime descriptive analysis via Postgres Views
- (internal) realtime exploratory analysis via marimo + FastAPI
Stack
- Svelte 5 + SvelteKit
- Paraglide i18n
- Bun server as middleware
- Supabase (Postgres and Storage)
- Python + marimo + FastAPI for realtime analysis
- Coolify for deployment
- TipTap v3 (Survey Editor)
- DeepL API
Details
- scope: bilingual website with 491 pages and counting
- at least a dozen content collections in the existing CMS - will be served as SSR Astro Server Islands
Stack
- Svelte
- Astro
- SvelteKit
Portfolio
Design Engineering | Data Visualization | Data Management | Tech Management | Storytelling | Geocomputation | Accessibility | UX
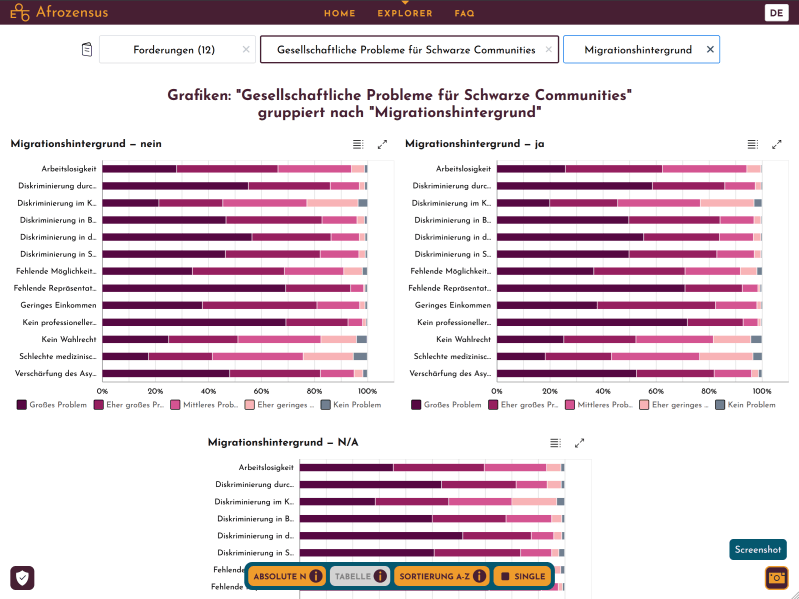
Afrozensus Data Dashboard
Concept, design, and implementation of a feature-rich full-stack Web App for the Afrozensus large-n survey. Users can explore survey results and group/facet single survey items with socio-demographic variables. Data engineering by https://twitter.com/lisa_reiber.
Rebuilt from scratch in 2025.
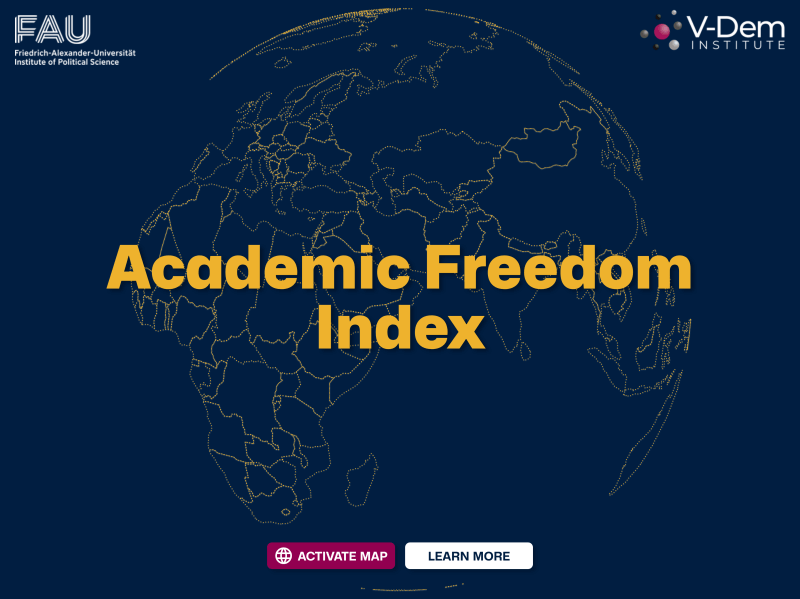
Academic Freedom Index
Concept, design, and implementation of a semi-static, self-updating website. The Hero is an interactive globe that displays the current Index results in a tooltip. A modal renders time-series data (1900-2023) for 6 metrics. Data is fetched on-demand. Charts can be exported as hi-res screenshots.
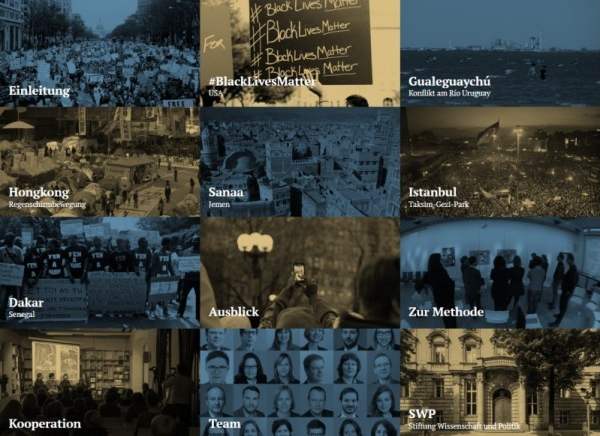
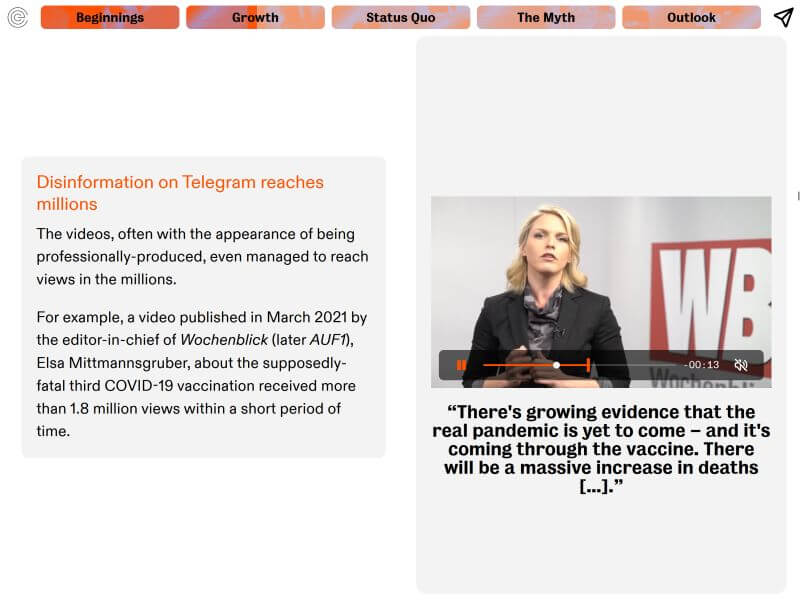
Telegram: Chronology of a Radicalization
Concept, UX design, and implementation of a multi-chapter interactive storytelling report.
Visual design by https://www.parat.cc/
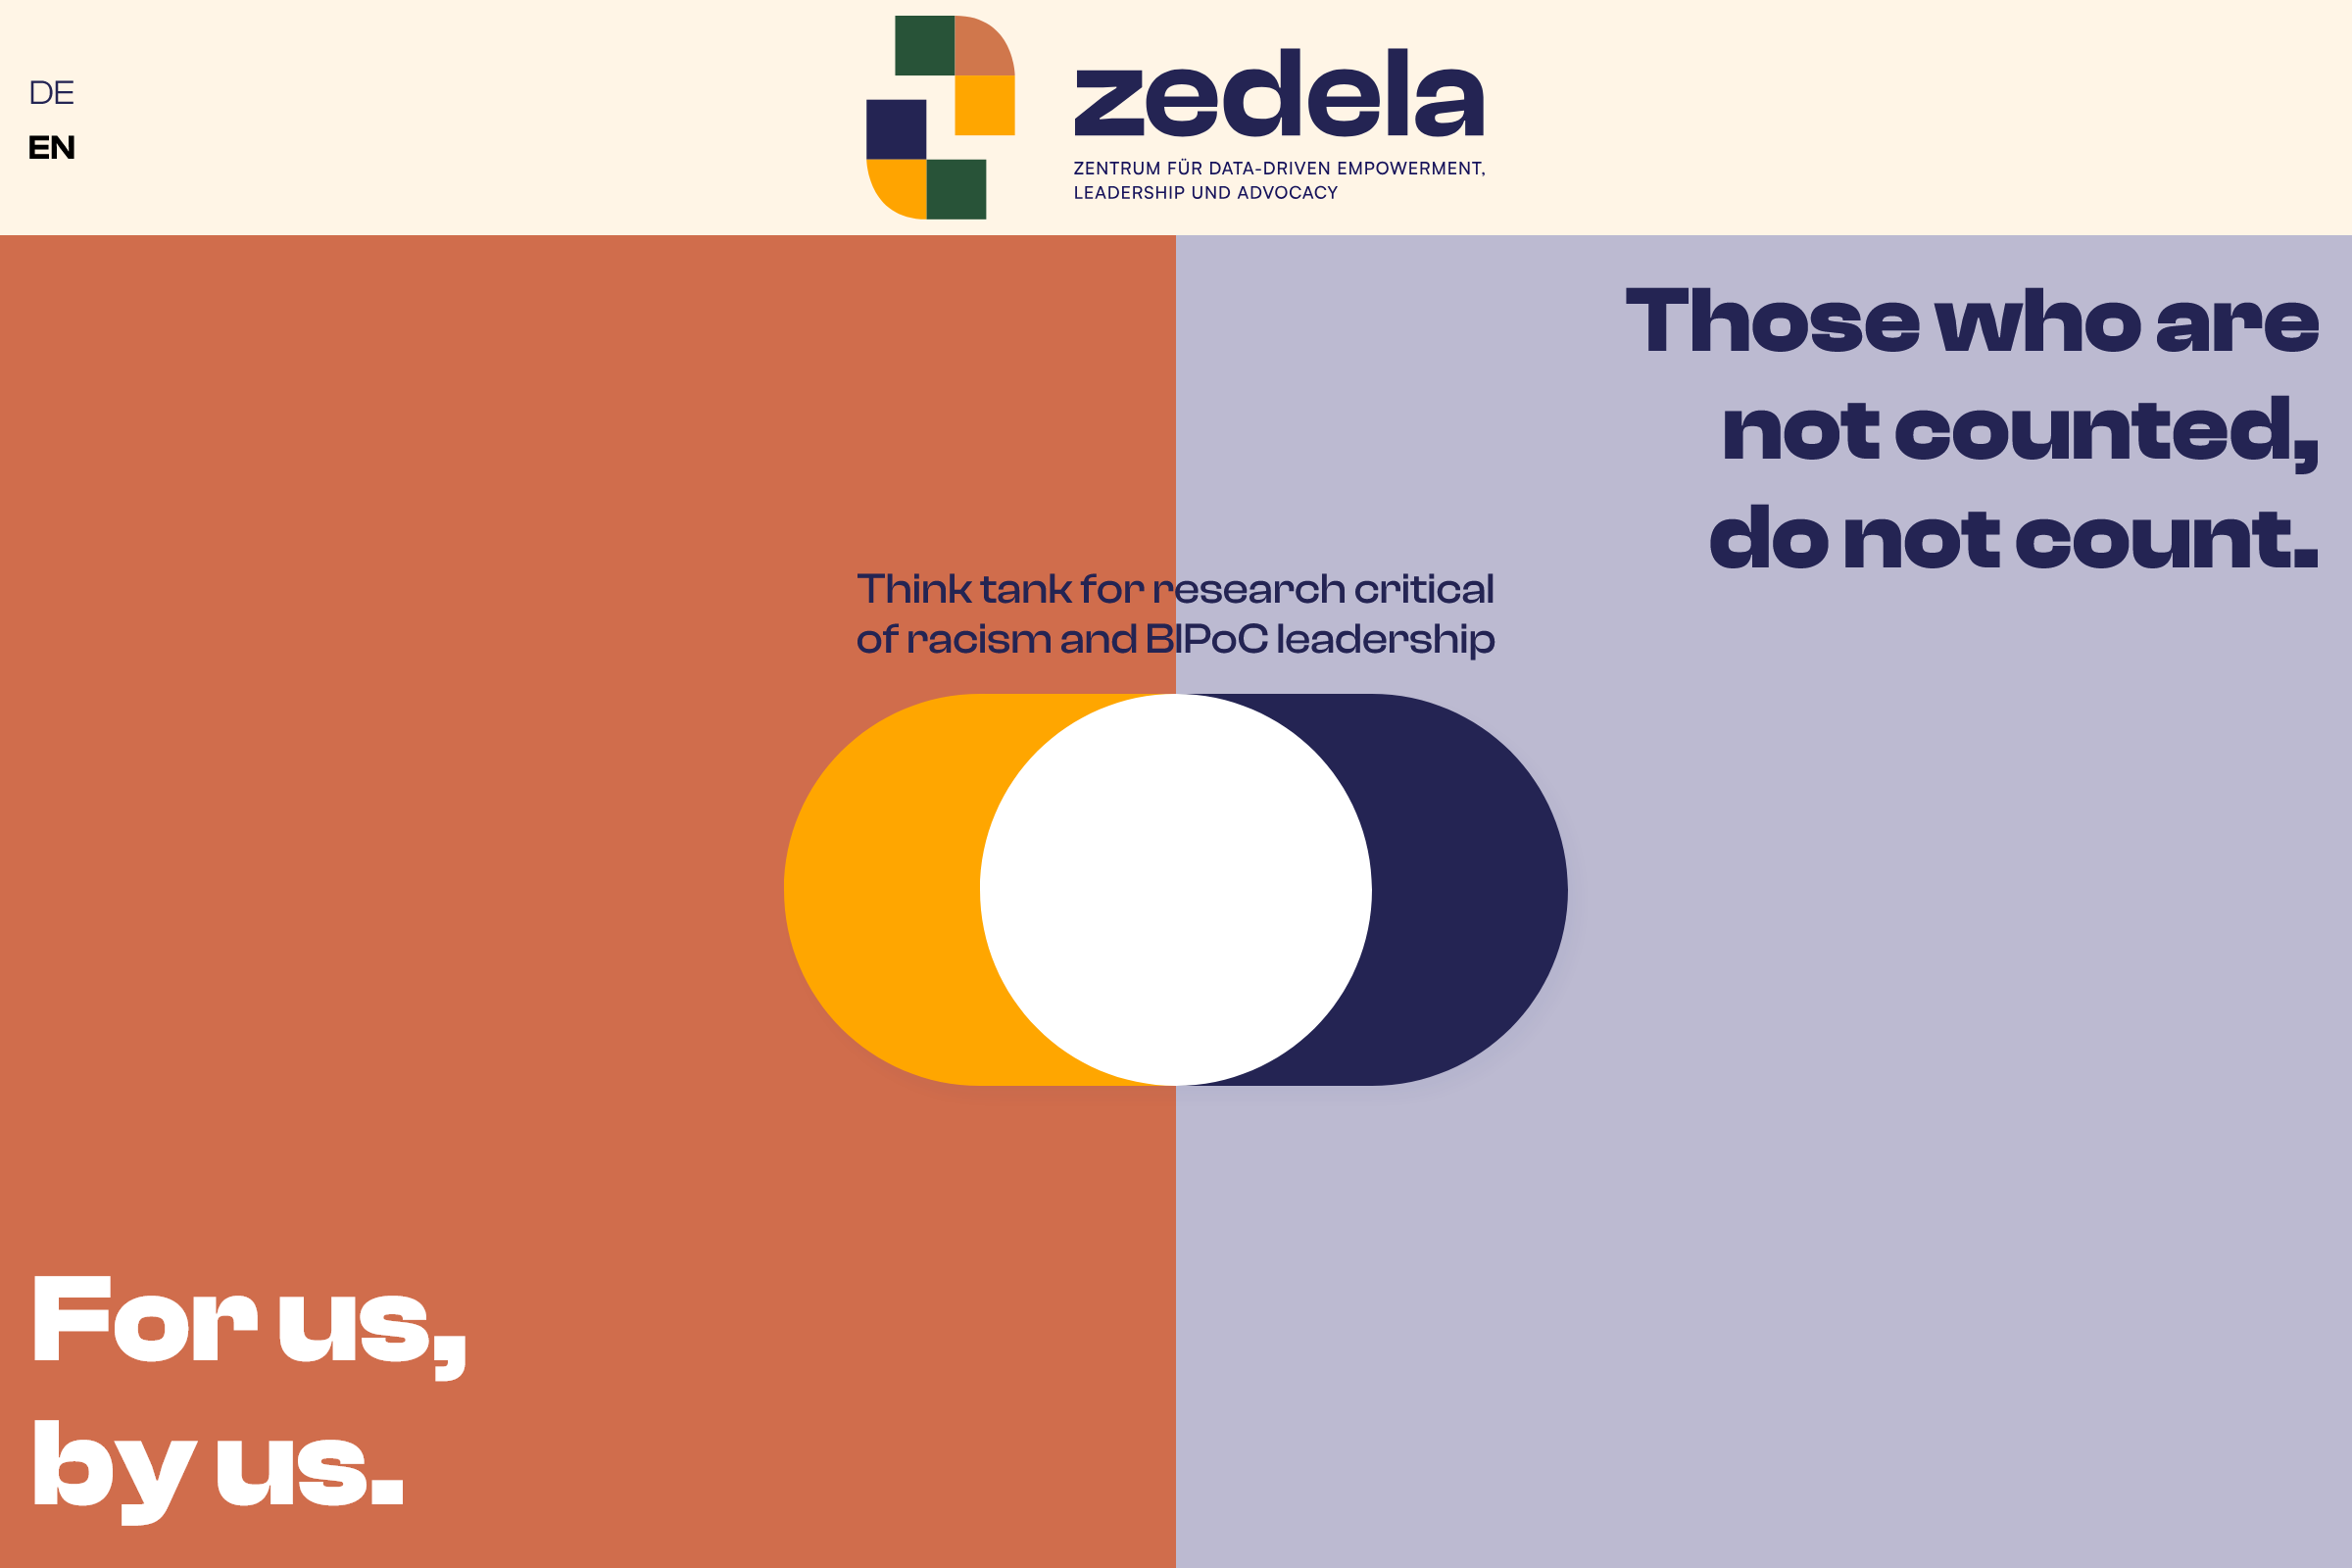
zedela.org
Concept / facilitation and development of a 2-track website for zedela, a Berlin-based NGO focussing on empowering BiPoC and fighting racism. Art direction / visual design by Hélène Baum.
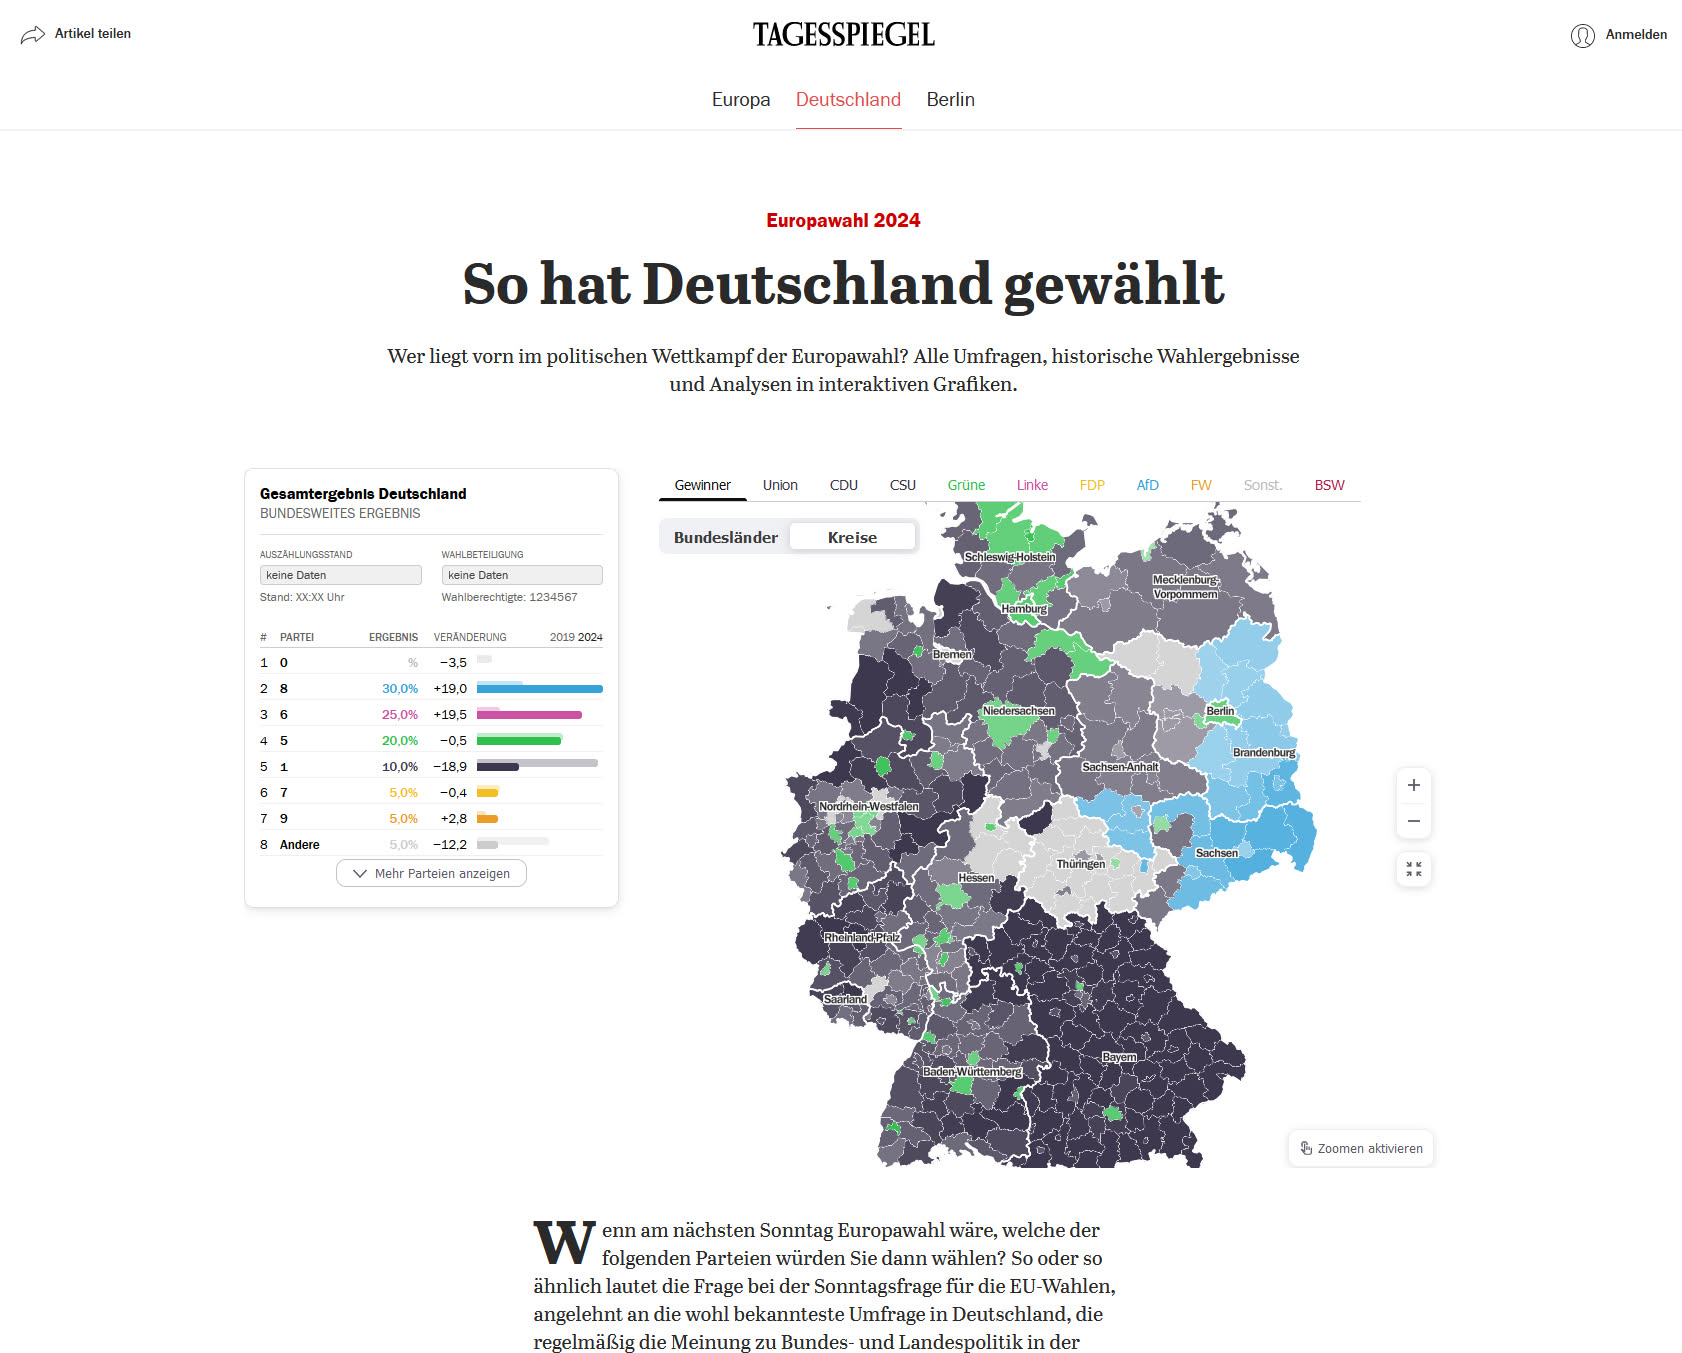
2024: Editorial Developer at Tagesspiegel Innovation Lab
In 2024 I spend a year as an Editorial Developer and shadow tech lead at the Tagesspiegel Innovation Lab - a data journalism team.
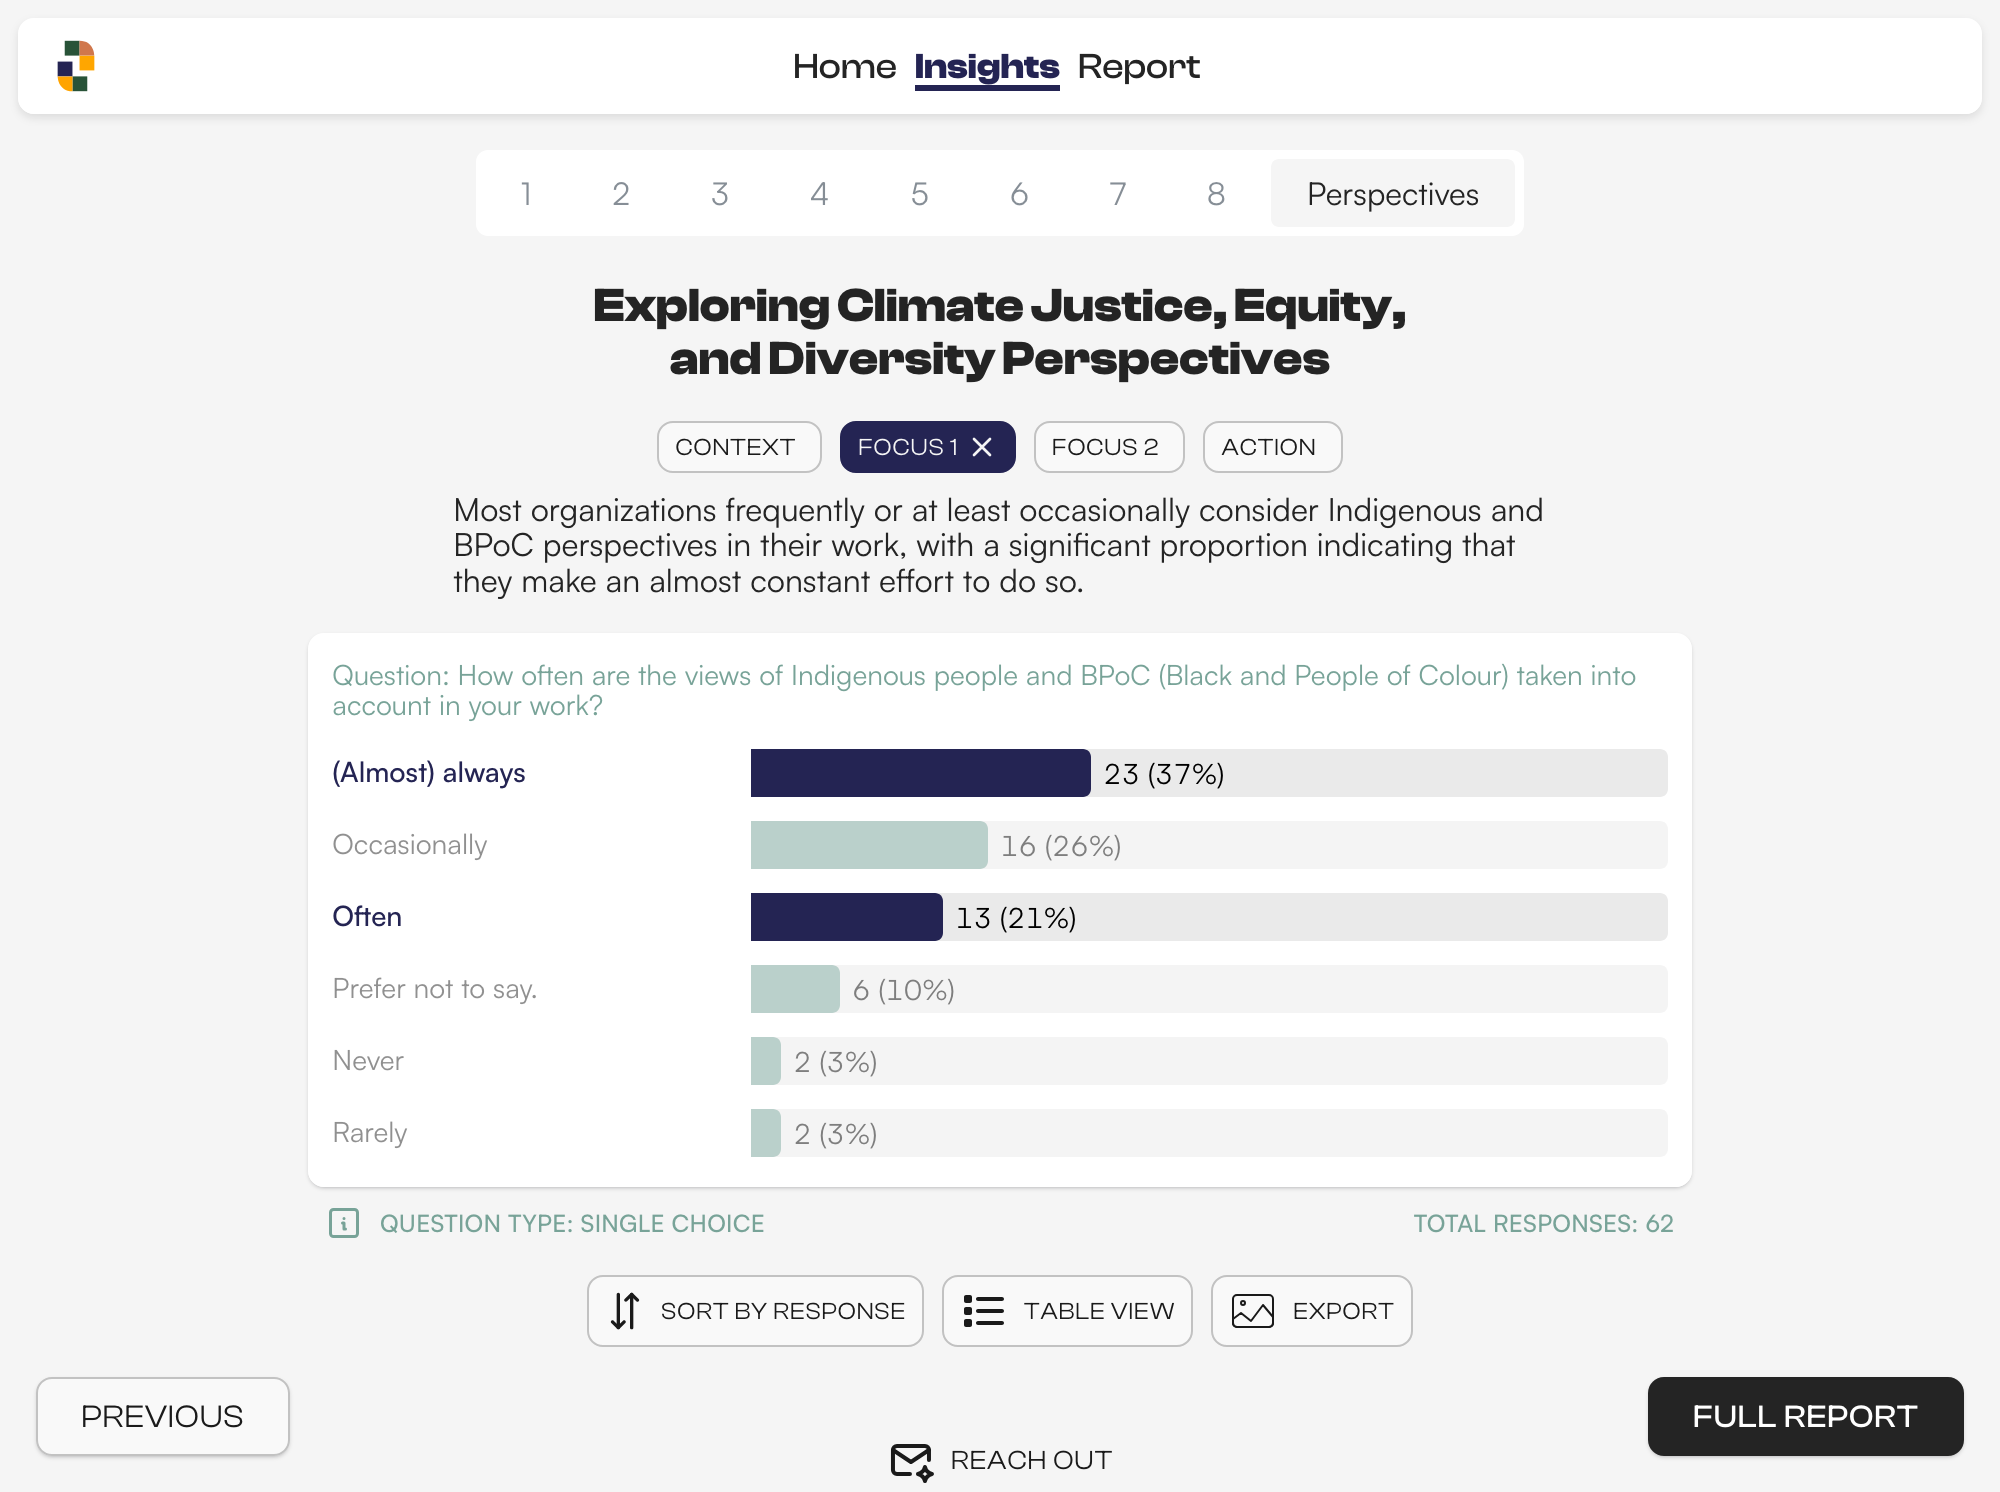
Climate Finance Fund
Interactive report and data exploration prototype for survey results. Instead of a dashboard, the user is guided through the results with “data stories” - preconfigured chart states with narratives.
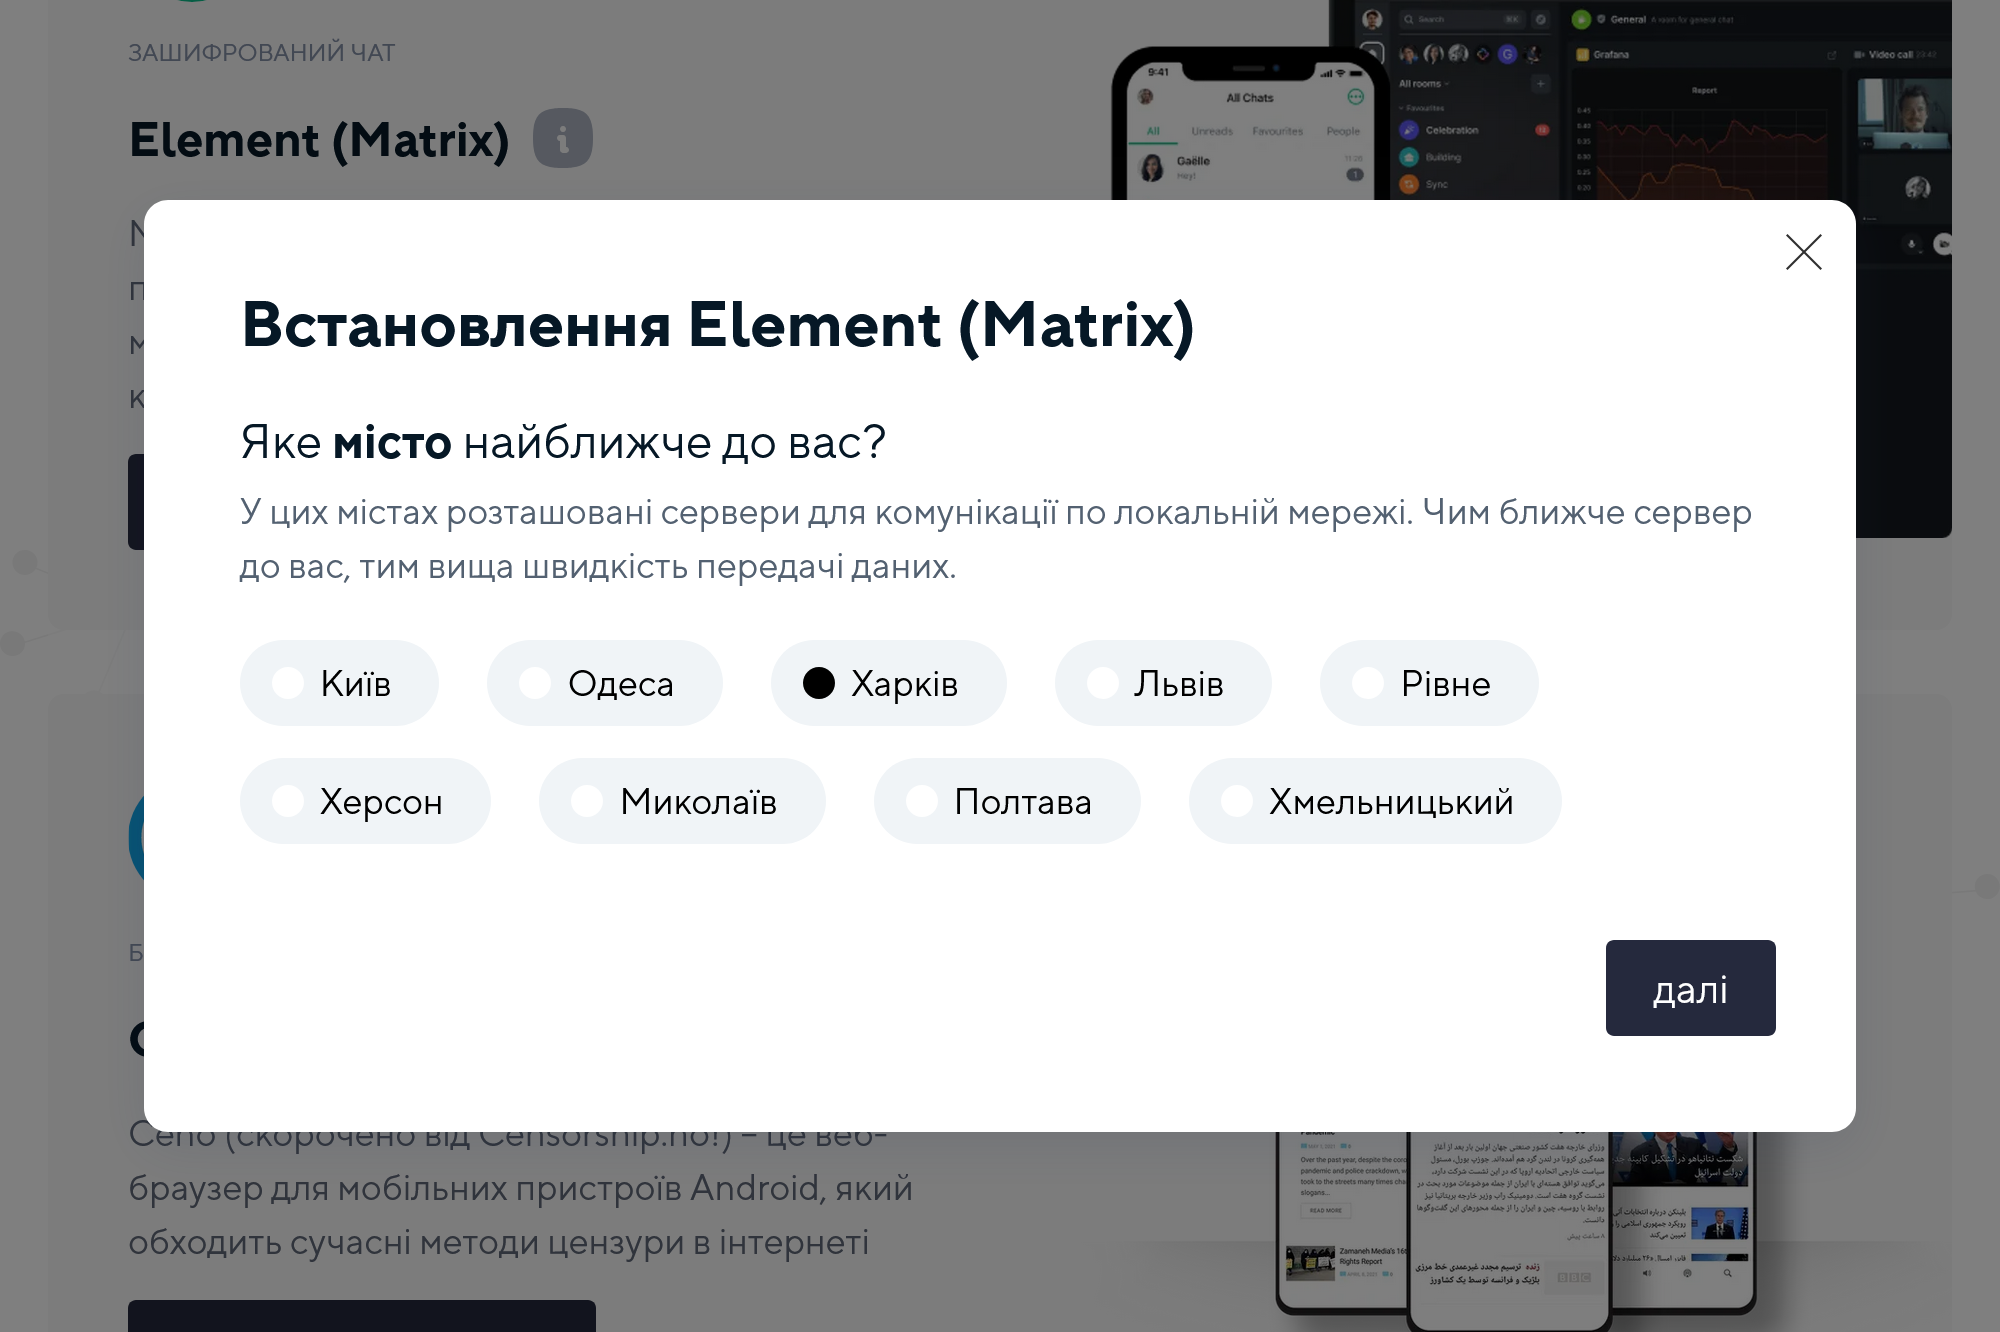
dComms Website
Implementation of a lightweight, interactive, multi-language website for eQualit.ie's dComms project. Guides help users set up decentralized communication tools.
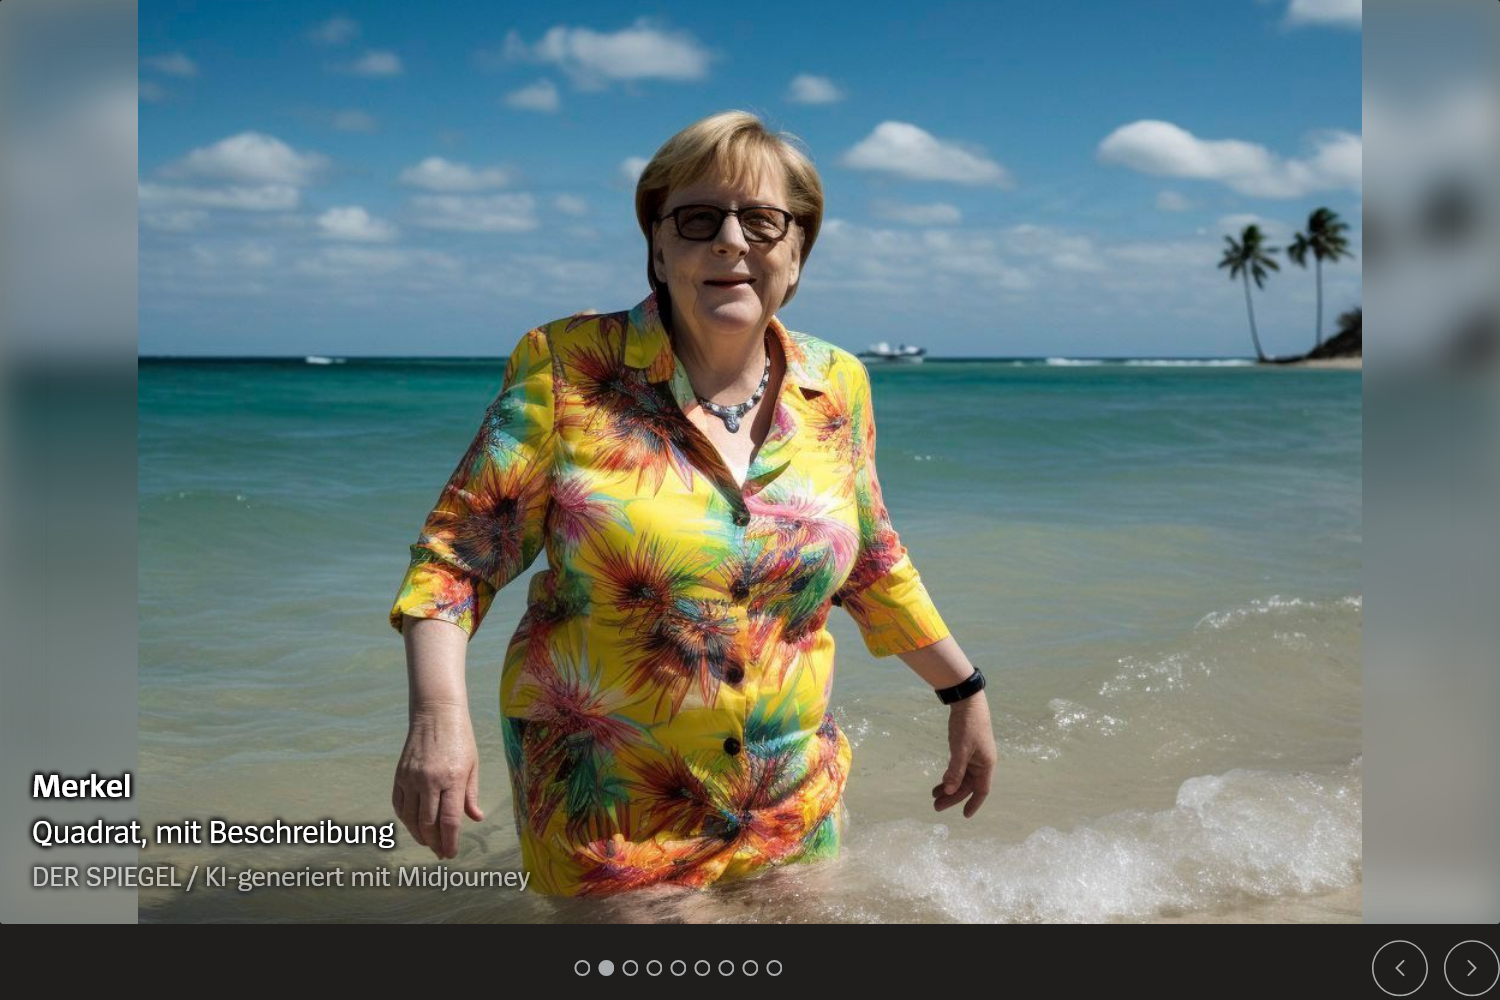
Der Spiegel: Carousel Component
Implementation of a Svelte-based image carousel with autoplay, horizontal swiping, accessible left/right navigation and progress dots.
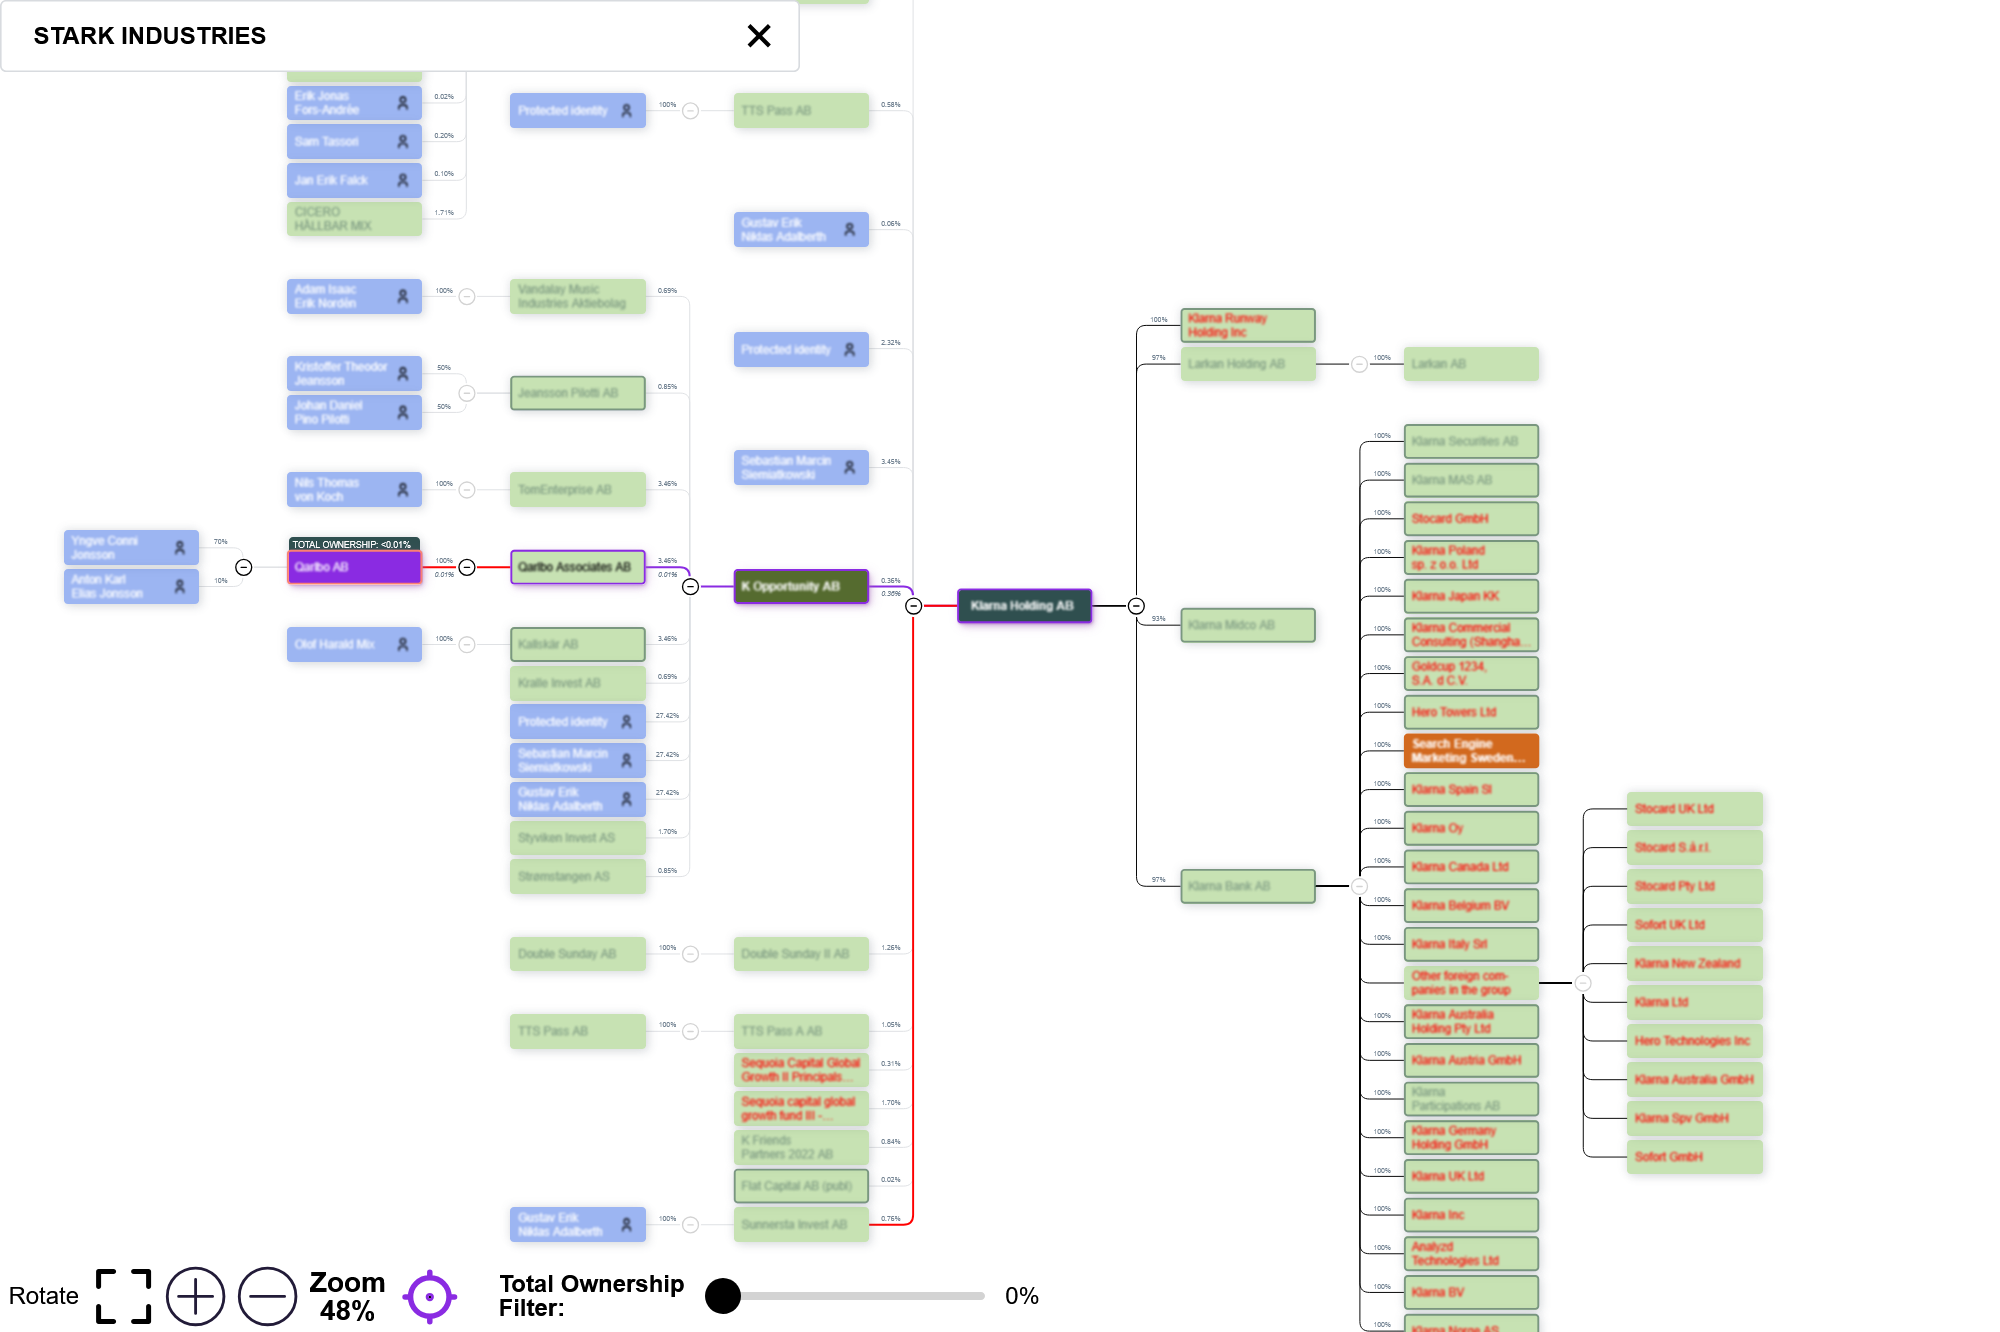
Two-Sided Dendrogram
Design and development of an interactive Svelte-based standalone module, integrated into a legacy (non-JS) application. Dynamically renders root-node-child and parent-root-node and -sibling relationships incl. data.
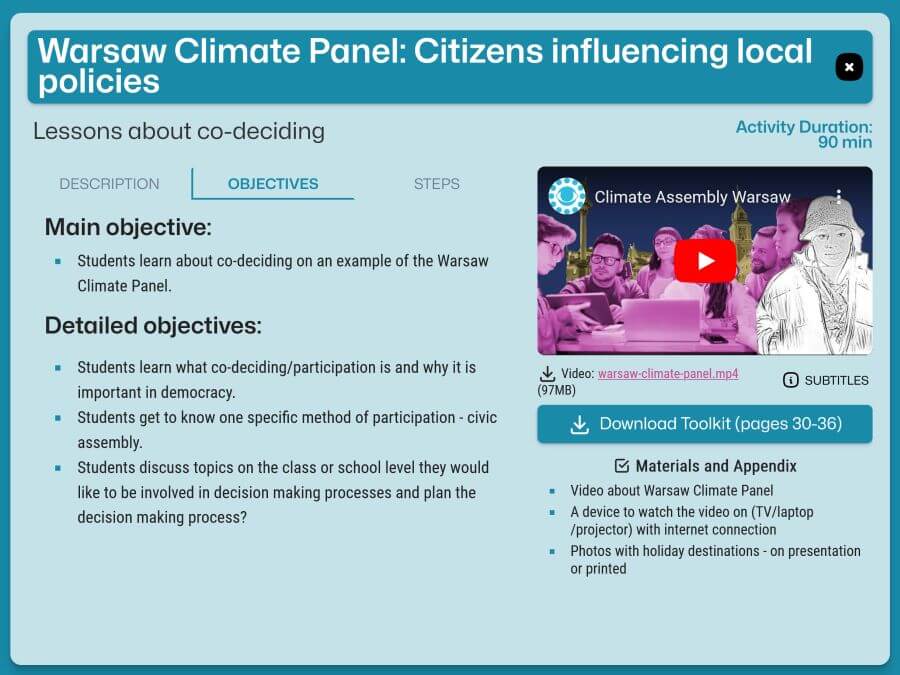
Democratic Innovations to Youth Work
Multi-language website built with Svelte, Astro and Notion API (CMS).
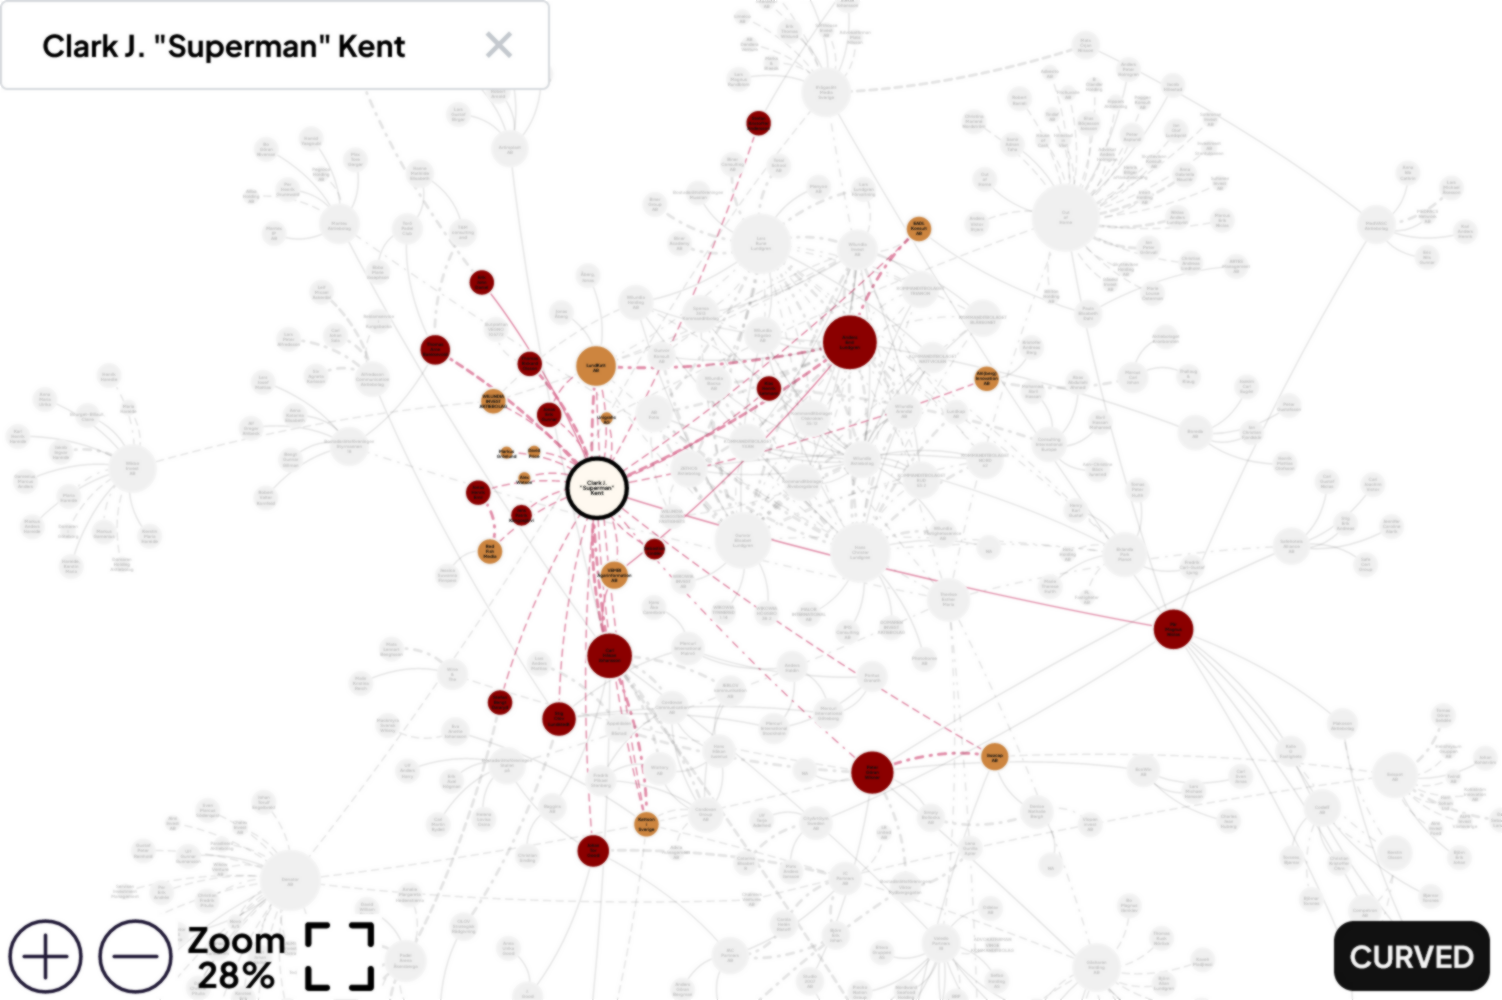
Network Analysis App
Design and development of an interactive Svelte-based standalone module, integrated into a legacy (non-JS) application. Dynamically renders 500+ nodes and 1K+ edges. Receives and sends events to interact with the parent application.
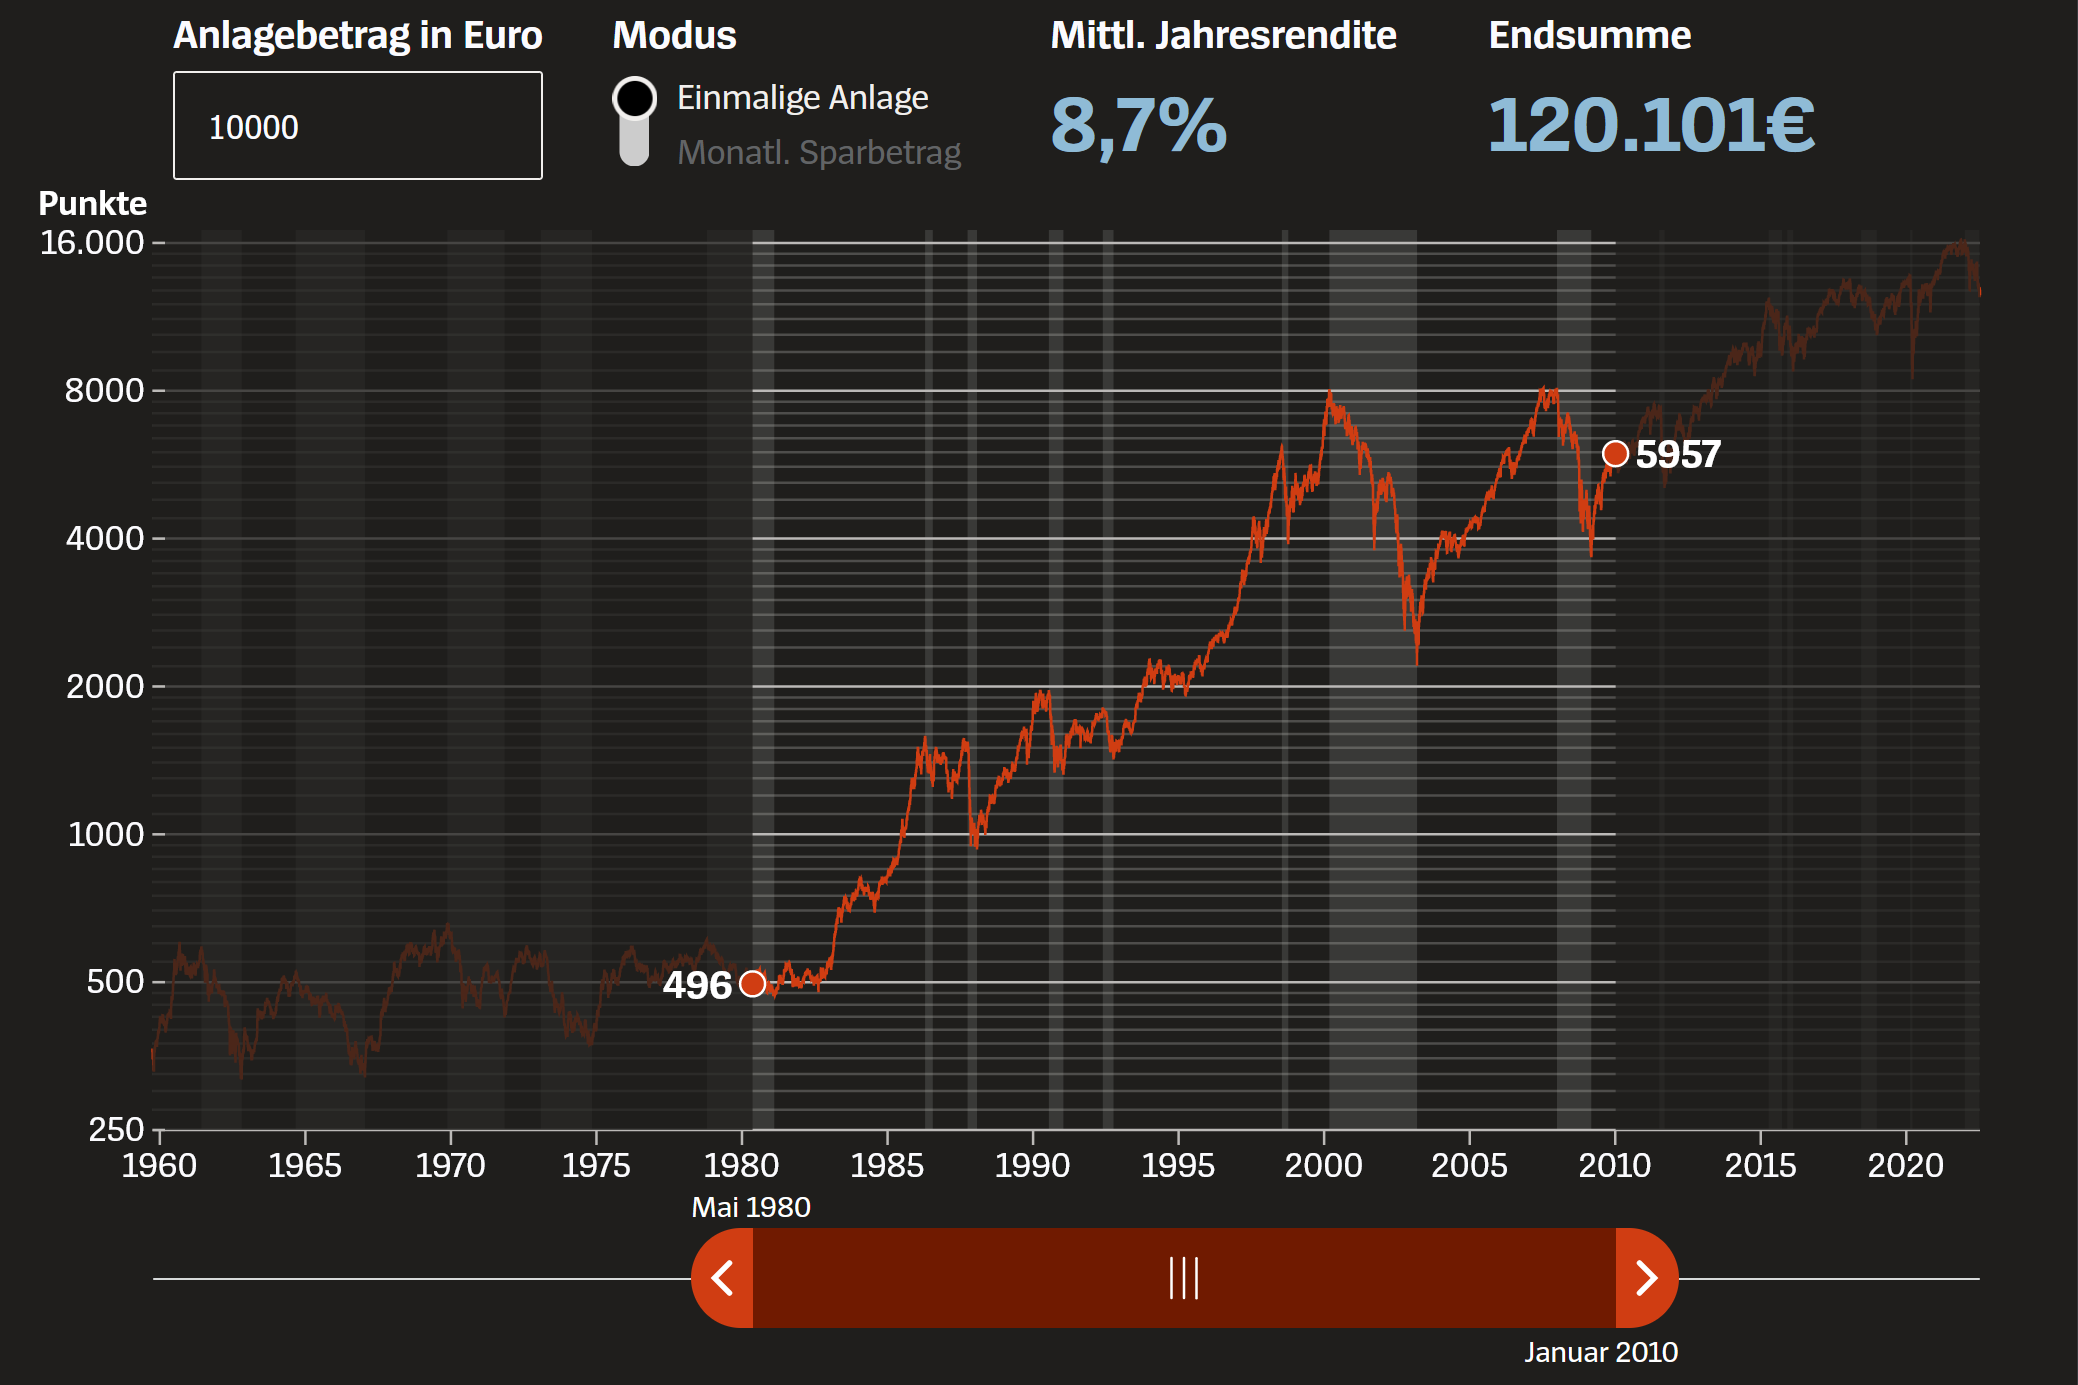
Der Spiegel: DAX Stock Game
Implementation of a Svelte-based interactive feature to explore historical DAX stock market data.
OSINT / Research Support: Mariupol
It was a special honor to support Human Rights Watch's Digital Investigations Lab as a consultant for this intense report. The report documents the extent of destruction in the city of Mariupol and identifies the Russian units involved.
Ukraine: Tank Deliveries Tracker
Short-term volunteering effort to track Western tank deliveries to Ukraine. We stopped tracking, because eventually there was nothing to be tracked...
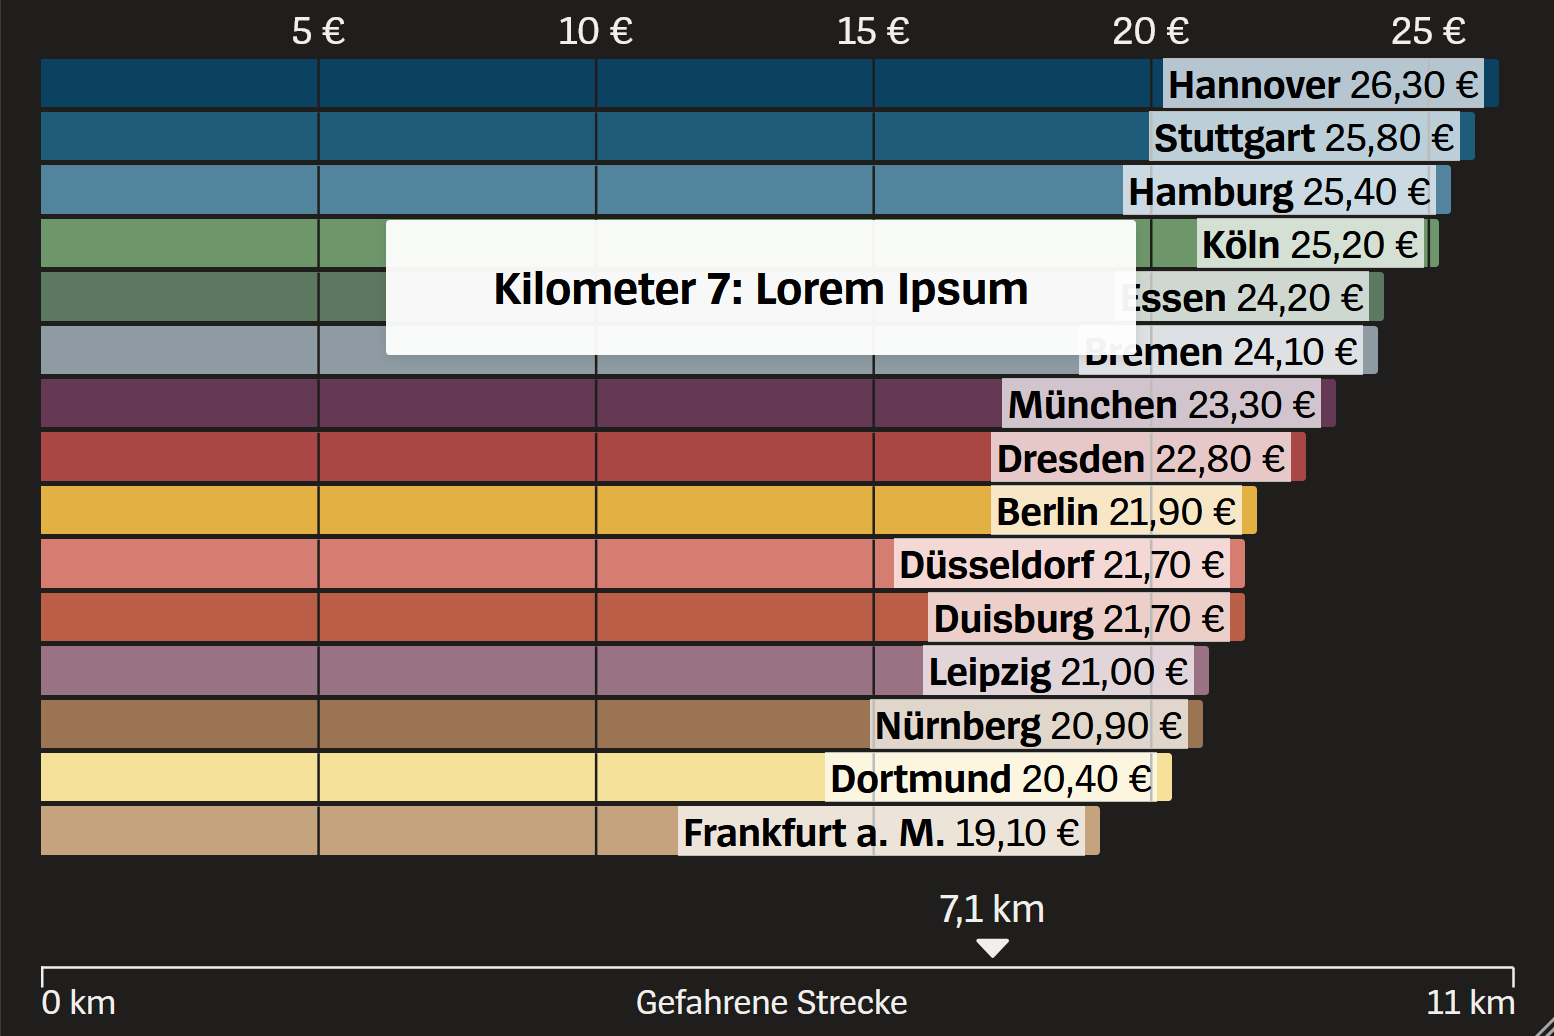
Der Spiegel: Bar Chart Race
Implementation of a Svelte-based feature which combines scrollytelling with a bar chart race (bars grow and shrink based on scroll progress and swap positions depending on their rank).
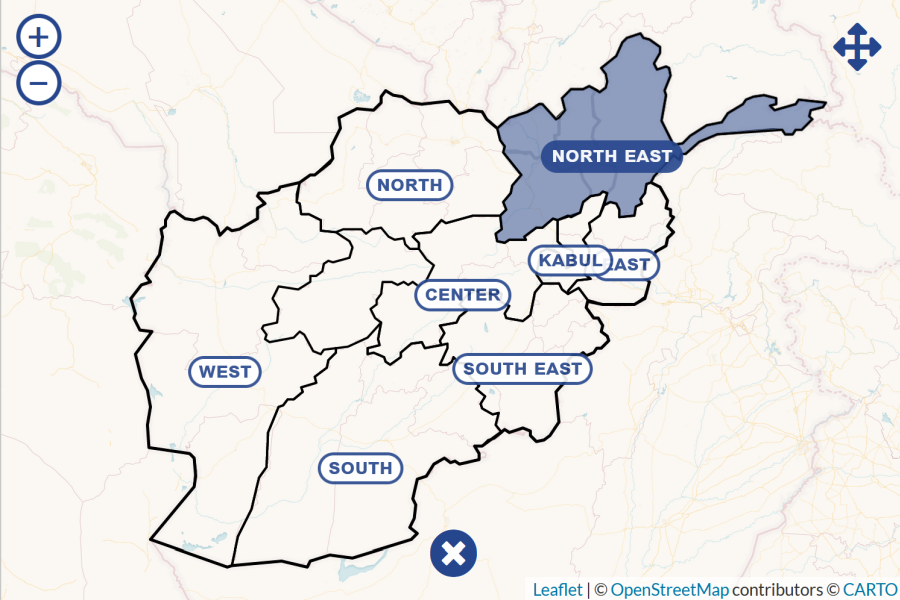
Map for FES Afghanistan
Leaflet map which displays region-specific sections of a written report in a multi-tab pop-up.
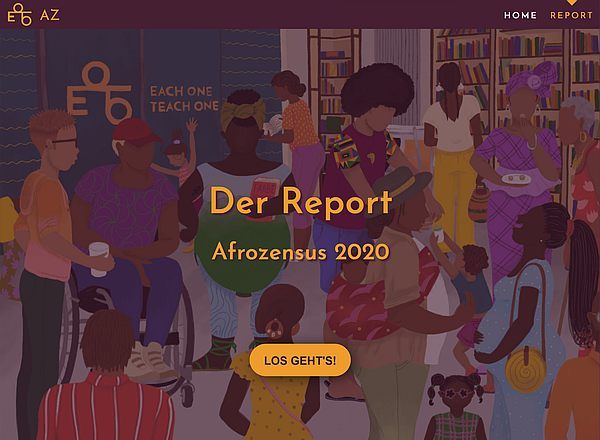
Afrozensus Website
Design and development of the official website of the Afrozensus project and the 2020 Report. The report is presented with a 2-part scrollytelling feature.
Translated and refactored in 2025.
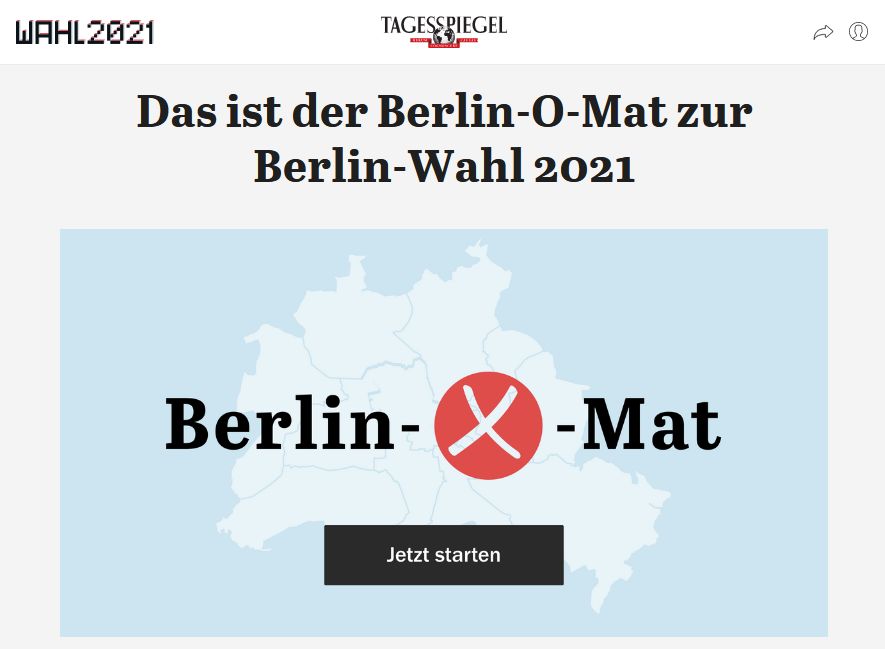
Berlin-O-Mat: Berlin 2021 Elections
Joint web project with Tagesspiegel and Humboldt-Universität zu Berlin for the 2021 State-level (Berlin) and local-level (boroughs) election. 2-in-1 voting advice application with a two-layered data model.
Follow The Money - Web Feature
Compagnon website for a research report. Scrollytelling + animated SVGs to narrate the executive summary.
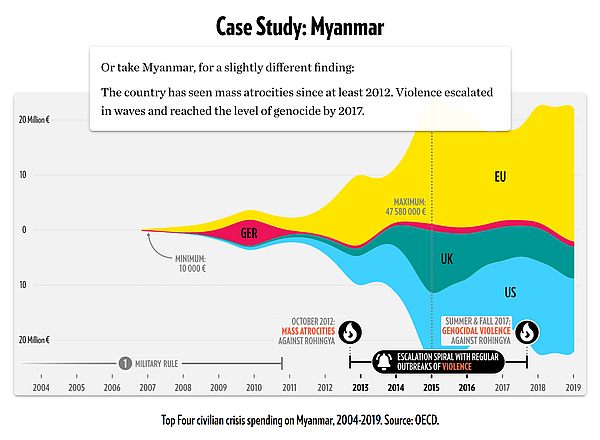
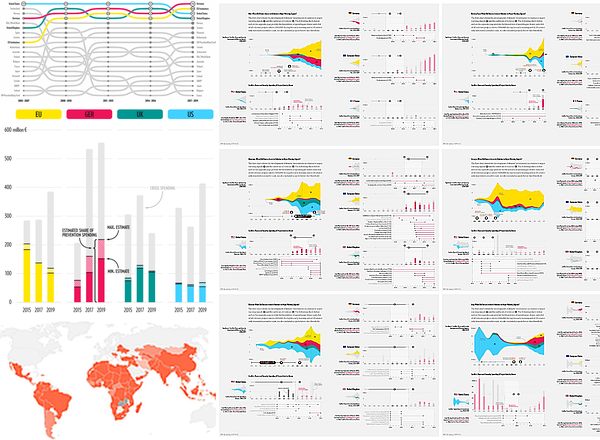
Follow the Money - Crisis Spending Report
6 double-paged infographics composed of 78 charts; 12 standalone charts of various types; produced with R & Affinity Designer
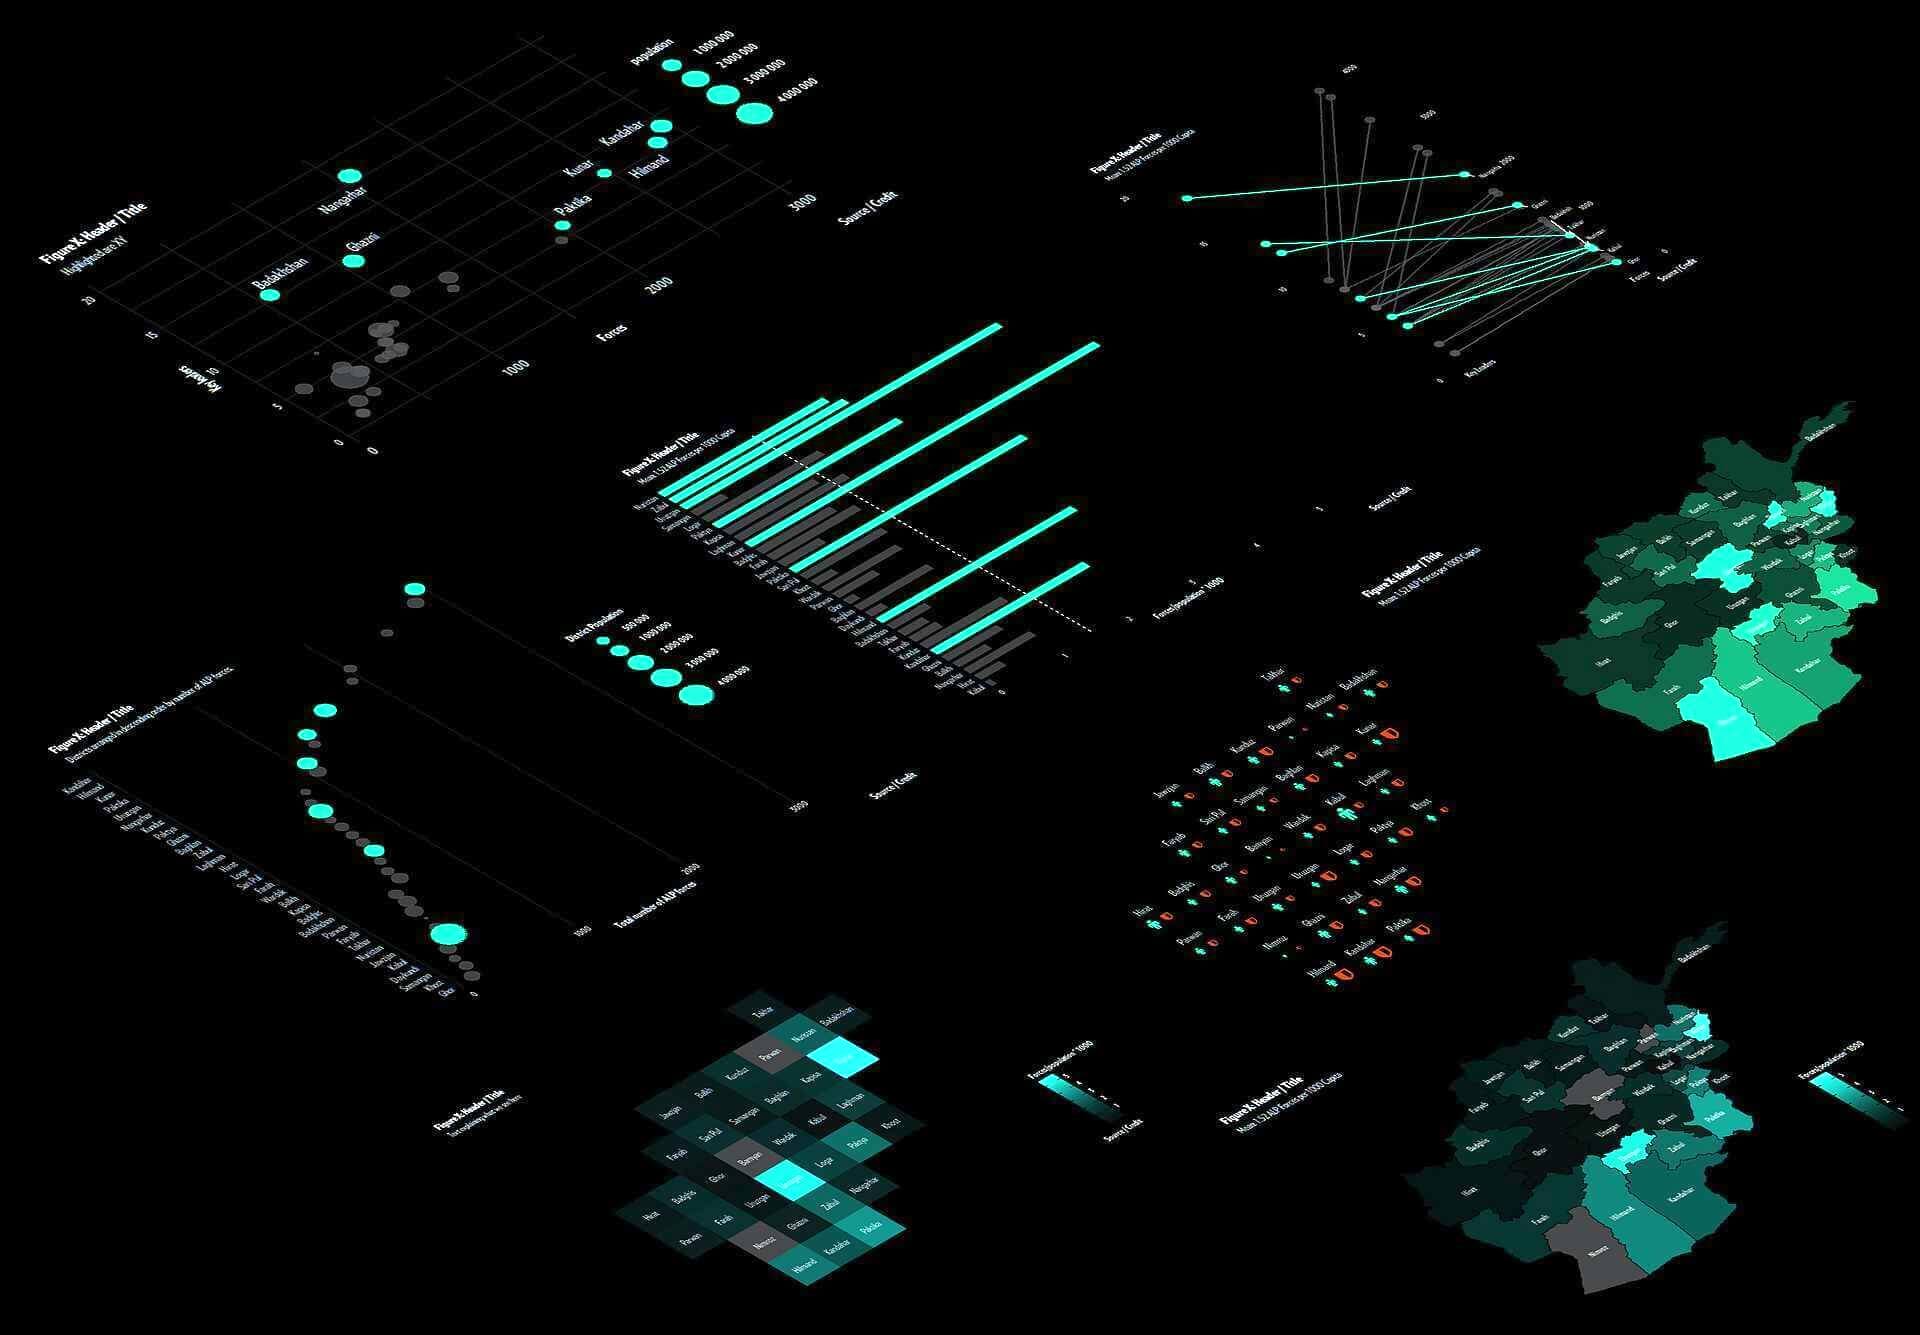
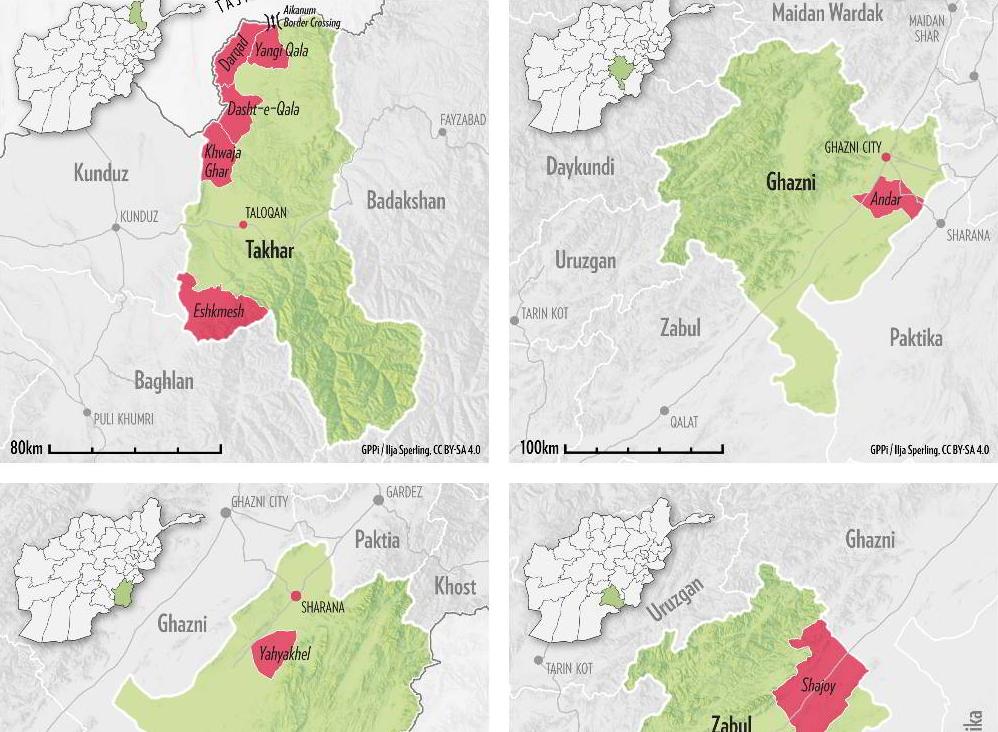
Militias in Afghanistan - Case Study Maps & Charts
Code-generated multi-layered case study maps based on UN HDX geodata and DIY hillshaded elevation data (rayshader & NASA SRTM). A single parameterized R template that was rendered for 5 case study maps.
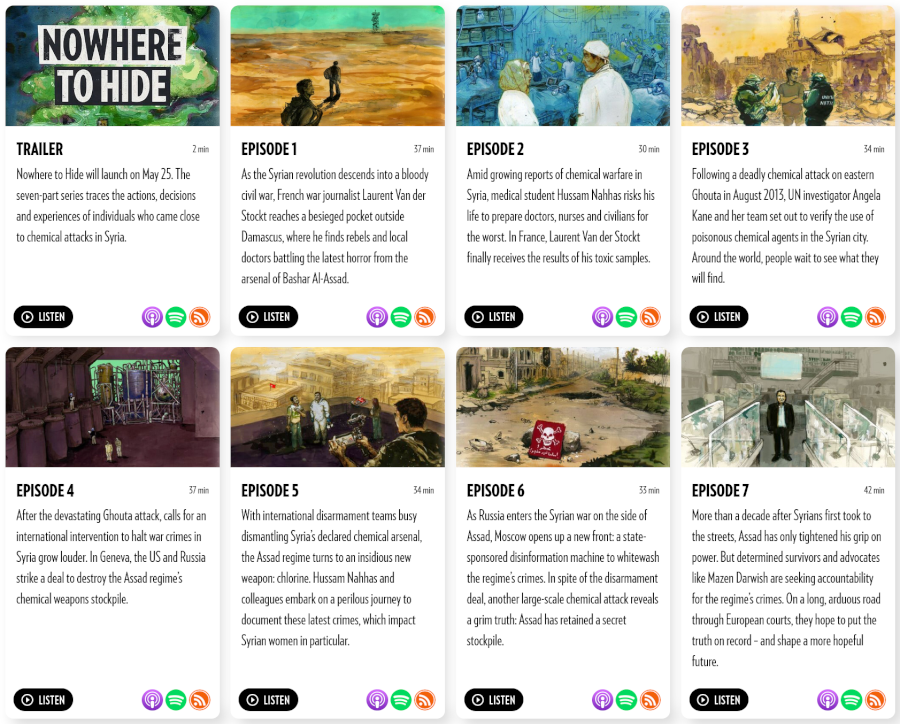
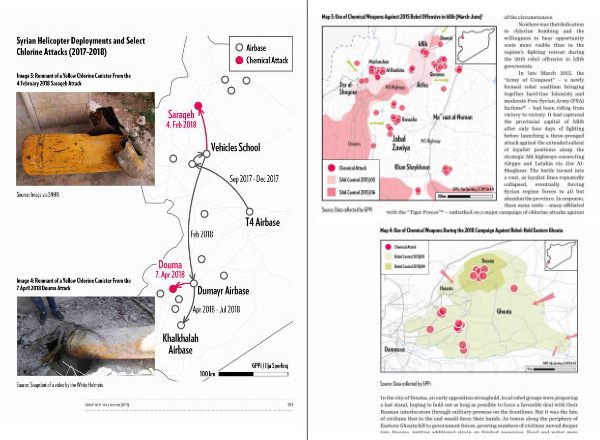
Chemical Weapons - Web Project
My first end-to-end product journey (concept, design, implementation, data pre-processing). Feature-rich static website for a multi-chapter essay & an interactive data portal. Features: map-based scrollytelling, case study components, timeline, audio snippets. Also available in Arabic.
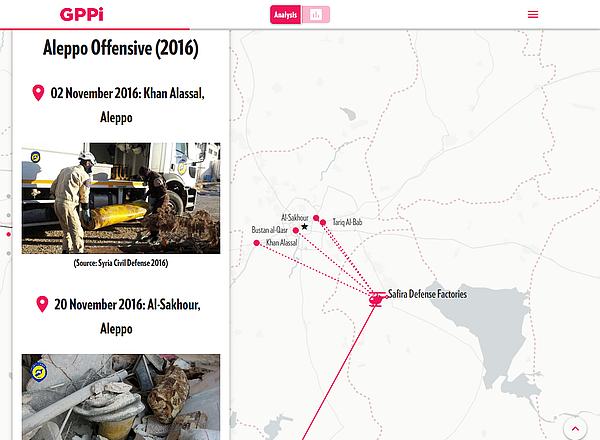
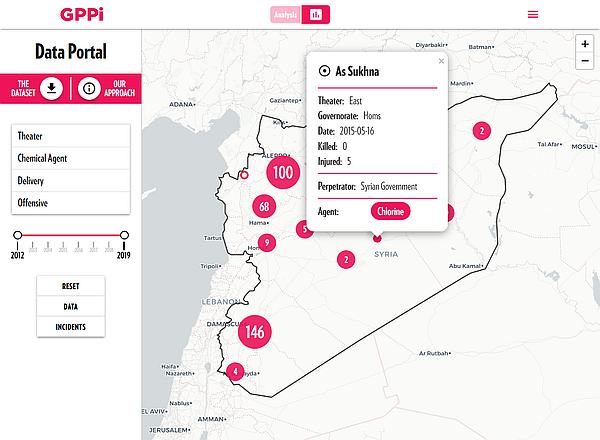
Chemical Weapons - Data Portal
Interactive map & data table view with dynamic filtering, incident clustering, and incident cards. Made with leaflet, crossfilter, dataTables, and a bit of D3. The data is auto-fed via a CI/CD-based end-to-end data pipeline.
Nowhere to Hide Report
Three case study maps, highlighting changes in territorial control during selected campaigns of chemical attacks. Two styleguide-compliant bicolor schemes represent gains/losses by rebels and state/regime actors. A full-page illustration outlines the deadly path of a helicopter regiment.
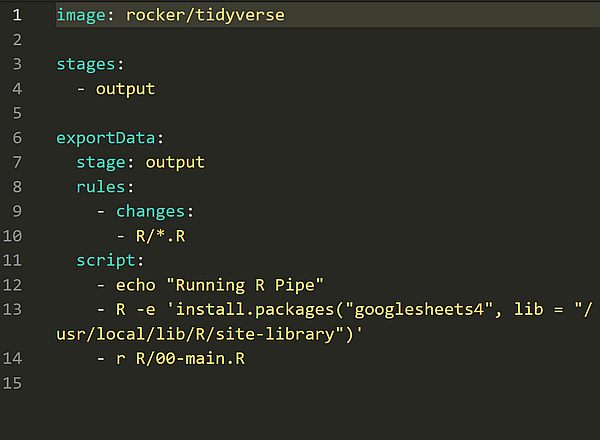
Data Engineering & CI/CD - Workshop
Introduction to data-centric DevOps & CI/CD. Hands-on workshop on implementing a ETL data pipeline with R & GitLab CI/CD.
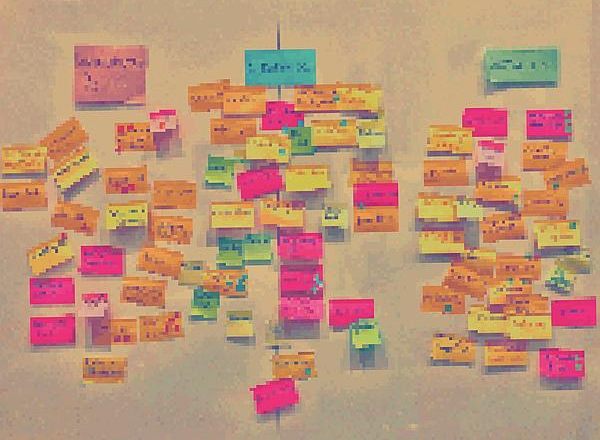
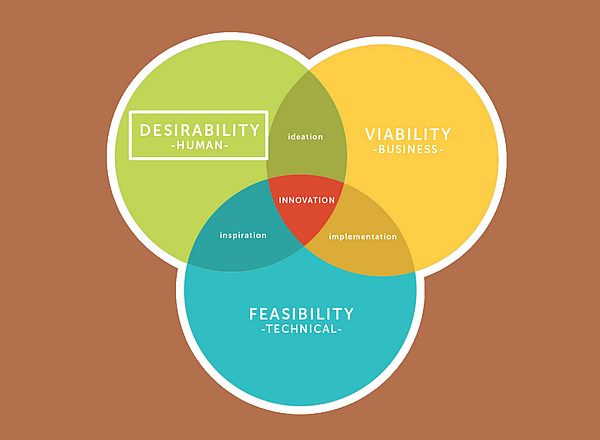
Design Thinking / Product Vision / Storytelling Sprints
I have successfully facilitated Design Thinking and Product Vision workshops with participants from academia, NGOs and policy. Together, we were able to make the abstract become manifest and actionable.
Information Security 101 - Talk/Workshop
360° introduction to individual and organizational risks and mitigation strategies for not-for-profit organisations.

Human Centred Design & Design Processes - Talk
Introduction to the "Why" & "How" of designing for usability. Focus is on understanding and feasibility from a non-profit persepctive.
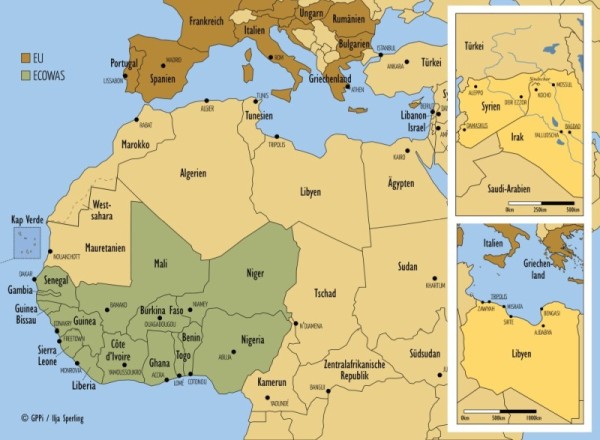
Krieg vor der Haustür
Colored regional map for the book's front matter, picking up the hue from the book's cover theme. Three tile-sized maps for the back matter, zooming in on single states and subregions.
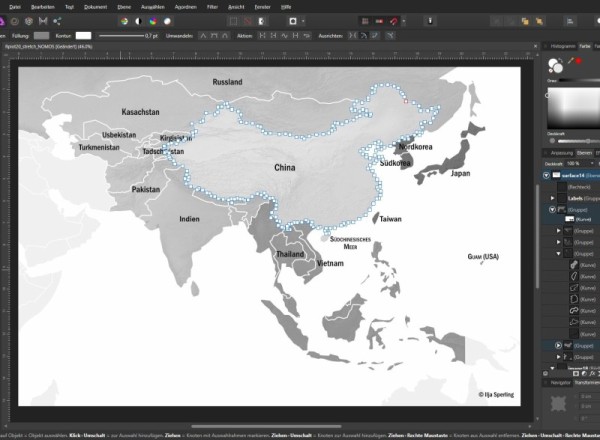
China's Silk Road
A full-paged b/w regional map of Asia, including the challenge of emphasizing four subregions.
Urban Spaces
Conception, technical project coordination, and content implementation of an online-first research paper design, complemented by a regular print product. This pilot involved a team of 30 people, and took more than one year from the first workshop to launch.